Vehicle Cards
Entity Dashboard & Cards
To access more detailed information about a specific entity, simply double-click on it from the list. This action takes you to the dashboard view, where various sections (referred to as cards) provide details on the entity's last known status.
Main Dashboard Cards:
| Dashboard Card | Functionality |
|---|---|
| Alerts | View the unattended alerts for this entity. |
| Pin Drop/Safe Zone | Manage a virtual fence around the entity, and be informed when the entity leaves. |
| Live Info and Events | View the last reported events. |
| Trip History | View a history of where the entity has been in the last 3 days. |
| Current Cycle | View information related to the current segment of the vehicle. |
| Asset/Vehicle | View any currently assigned entity such as the information of the vehicle or asset. |
| Photos | View the last captured photo and its location & time. |
| Features | Manipulate the devices’ features such as the Safe Engine Immobilization or activate a different output. |
| Sensors & Inputs | View the state of any connected inputs & sensors. |
| Metrics | View information relevant to the odometer or total engine on time. |
Submenus/Widget Information: Different widgets or sections can be accessed from the icon on the top right, next to the online state.
| Item | Functionality |
|---|---|
| Details | View the entity’s properties and details. |
| ECU Data | Shows vehicle data from the onboard computer, as well as TPMS information (requires an accessory). If the vehicle stops reporting for more than 7 days, the last reported data will not be visible. |
| Chat | Enables direct chat with a selected asset. |
| MDT | Allows sending messages to the device connected to a selected vehicle (note: these messages are not device commands). |
| Connectivity | Displays relevant information about tracking equipment connectivity with Pegasus, GPS status, and SIM card status. |
| Device Console | Enables sending commands directly to the device and observing the history of sent commands (requires special permission). |
Main Dashboard
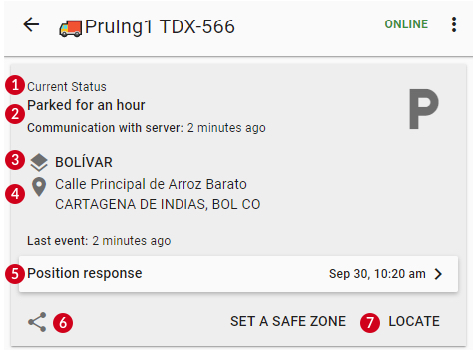
Use the image below to identify the main components of cards on the main dashboard.
- Name of the card
- Current status / most relevant information
- Geofence where it occurred
- Address
- Main content (events for live, or photos)
- Secondary action button
- Primary action buttons
Notifications
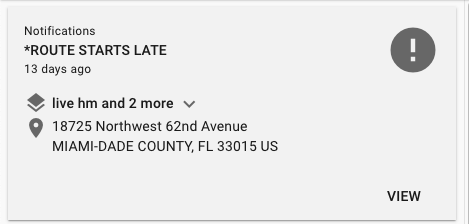
The notifications card displays the last unattended alert, prioritizing critical alerts over warnings and informational alerts. Therefore, you'll always see the most critical alert first until it's attended to. To address the alert, simply click on the VIEW button.
Current Status
This section displays the most recent status of the entity, including its current trip status and the timestamp of its last connection.
It is important to differentiate between the last communication and the last event. Events occur when significant conditions arise on the device, such as button presses, speed violations, or ignition activations. Meanwhile, the device continually attempts to maintain its connection to the system in the background. Therefore, during periods without events, the device transmits a message to the system to sustain the connection. Consequently, it is normal to observe a more recent last communication timestamp compared to the last event.
By clicking on the name of the generated event, you can access a list of the most recent events.
- Primary Actions: The primary actions involve updating the vehicle's location and setting a safe zone (further details below).
- Secondary Actions: Secondary actions include options to share the vehicle's location or utilize it for navigation purposes.

Safe Zone
The safe zone feature creates a virtual perimeter around your entity and notifies you via email if this perimeter is breached. Additionally, it can automatically take actions such as activating the Safe Vehicle Immobilization feature when a breach occurs.
On the map, you'll notice a vehicle has violated its safe zone when its icon turns red and pulsates.
Trips
Trip Information: Displays the last trip status, including the time and date of departure. Note that if the entity is stationary, this card may not be present. Additionally, it can also display the current status of a route if it’s programmed.
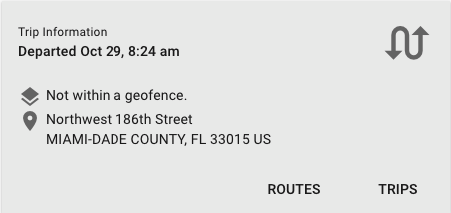
- Routes: The routes view displays the active route of the vehicle.
Please note that routes appear two hours before the scheduled start time and up to four hours after arrival time at the destination unless another route is scheduled before this. In such cases, it shows the next route.
Routes can include multiple checkpoints, and during tracking, you can monitor route completion by checking the scheduled time of arrival and whether they are on time or have missed their next checkpoint. - Trips: The history view in tracking quickly displays the last three days' worth of trips.
Clicking on "History" provides an overview of the entity's recent trips. Selecting a trip reveals its path on the map, and clicking the right icon offers more details about that specific trip. Use the back arrow to return to the list of trips.
Similar to the vehicle list, you can adjust the information displayed in the list of trips by clicking the switch icon at the bottom. This information may include the maximum speed for the trip, time spent over the speed limit, idle time, or fuel consumption.
Additionally, from the list of trips, you can choose to view only the stops made or both the trips and stops using the icons along the bottom.

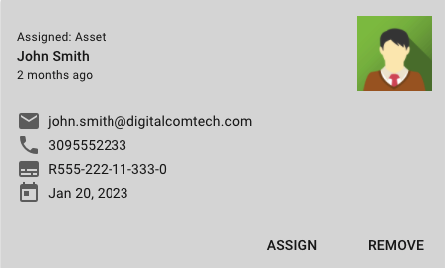
Asset Info (Driver) & Assignment
Asset information will be shown in this card, it includes the asset type, which can be a driver, as well as the other info fields such as email, phone, license, and expiration date.
Please note that the asset type: Driver can only be assigned to 1 vehicle at a time.
Assets can be manually assigned or automatically via iButton, RFID, Taurus, or Bluetooth Tag.
You can change the assignment of a driver manually at any time by clicking on the ASSIGN button. You can also click on the REMOVE button anytime to remove that driver.
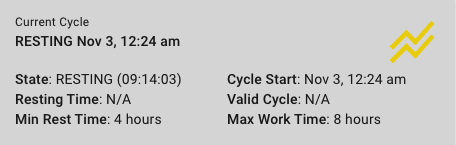
Current Cycle
The current cycle card shows information related to the current segment of the vehicle. For example, it shows when the entity begins to work or when begins to rest, the amount of hours that the entity has been working or resting, if the entity is overworked, etc. For more explanation visit the Hours of Service Section.
Photos
There’s a card for viewing the last photo captured with the Taurus app or the Photocam accessory, you can also browse a list of previous photos taken. If you use the camera accessory you will find a CAPTURE button.
Note that once a photo is captured it takes some time, a couple of seconds up to a minute depending on the network connections.

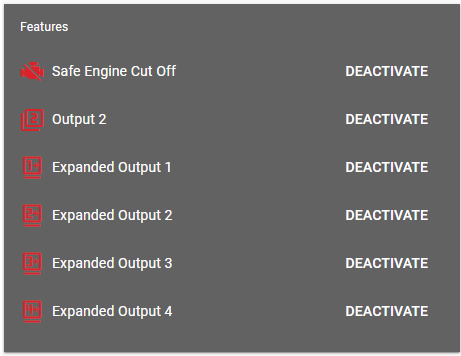
Features
Depending on which device and accessory you have installed, you’ll see a list of features or outputs that are enabled in this section. These outputs can be turned ON/OFF remotely with this section.
Activating the Outputs
One of the important outputs From the dashboard we can activate or deactivate the Safe Engine Immobilization by clicking on the button on the right of the icon. (Please note that Safe Engine Immobilization is a feature that has to be previously installed by a professional inside your vehicle).

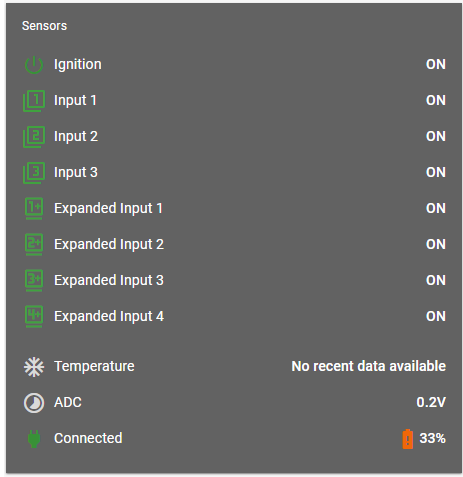
Sensors
The sensors section shows an overview of the state of the last connected sensors to the device. The sensors can include any input sensor, like to know if a door is closed, or if something’s activated.
Temperature data is available as long as you have the necessary accessory. Here you’ll be shown the last temperature reported.
ADC is a voltage value that comes from a cable called an ADC cable on the device. It converts any analog value that’s sensing between 0-10V and reports it here.
The connected state refers to the external power connection for the device, and the battery refers to the devices internal battery.
| Battery Icon | Description | ||
|---|---|---|---|
 | The battery status was never detected | ||
 | The battery state is detected but disconnected or 0V. | ||
 | The battery percent is between 95% and 100%. | ||
 | The battery percent is between 60% and 94% | ||
 | The battery is charging and the percentage is between 60% and 95%. | ||
 | The battery percent is between 20% and 60% | ||
 | The battery is charging and the percent is between 20% and 60%. | ||
 | The battery percent is between 0% and 20%. | ||
 | The battery is charging and the percent is between 0% and 20%. |
Submenu & Widgets
Vehicle Details
Within the menu, you will see the Details section, where we can find all the information relevant to the entity and the device associated with it. From top to bottom, we find:
- Photo of the vehicle (In case of having it added).
- QR code to associate with the Taurus tracker APP.
- Description of the vehicle (plates, tank size, brand, etc).
- Properties: Extra information we have added.
- Device: Tracking equipment associated with the vehicle, its managed configuration, and firmware version.
- SIM: Data of the SIM Card that the tracking equipment has
- Driver: If associated, it shows the driver’s data.
ECU or Engine Data
If the device has a compatible accessory installed, we will see the information it extracts from the vehicle’s computer. Among the parameters detected by the ECU we can highlight fuel level, hour meter, odometer, and tire pressure.
Tire Data
| Tire Icon | Description |
|---|---|
 | The tire is not presenting any data. |
 | The tire is reporting no errors. |
 | There is an underinflation warning from the tire. |
 | There is a critical underinflation warning from the tire. |
Chat/MDT
The chat is enabled for entities that are using the Taurus app, it allows for you to chat with the application.
If the entity has an MDT-type screen or some serial communication accessory installed. We can see in this section the data that the accessory sends to the Syrus, as well as the messages that we have sent.
Connectivity
It shows us relevant information regarding the connectivity of our tracking equipment with Pegasus as well as the status of the GPS and the SIM card.
Device Console
It allows us to send commands directly to the connected device and observe the history of sent commands.
Updated 5 months ago