Rawdata
The Rawdata application provides a comprehensive report of all events and data transmitted by your devices directly to the Pegasus servers in their original format. With this app, you can visualize the data on a map and apply various filters to analyze it effectively.
Generating Rawdata Reports
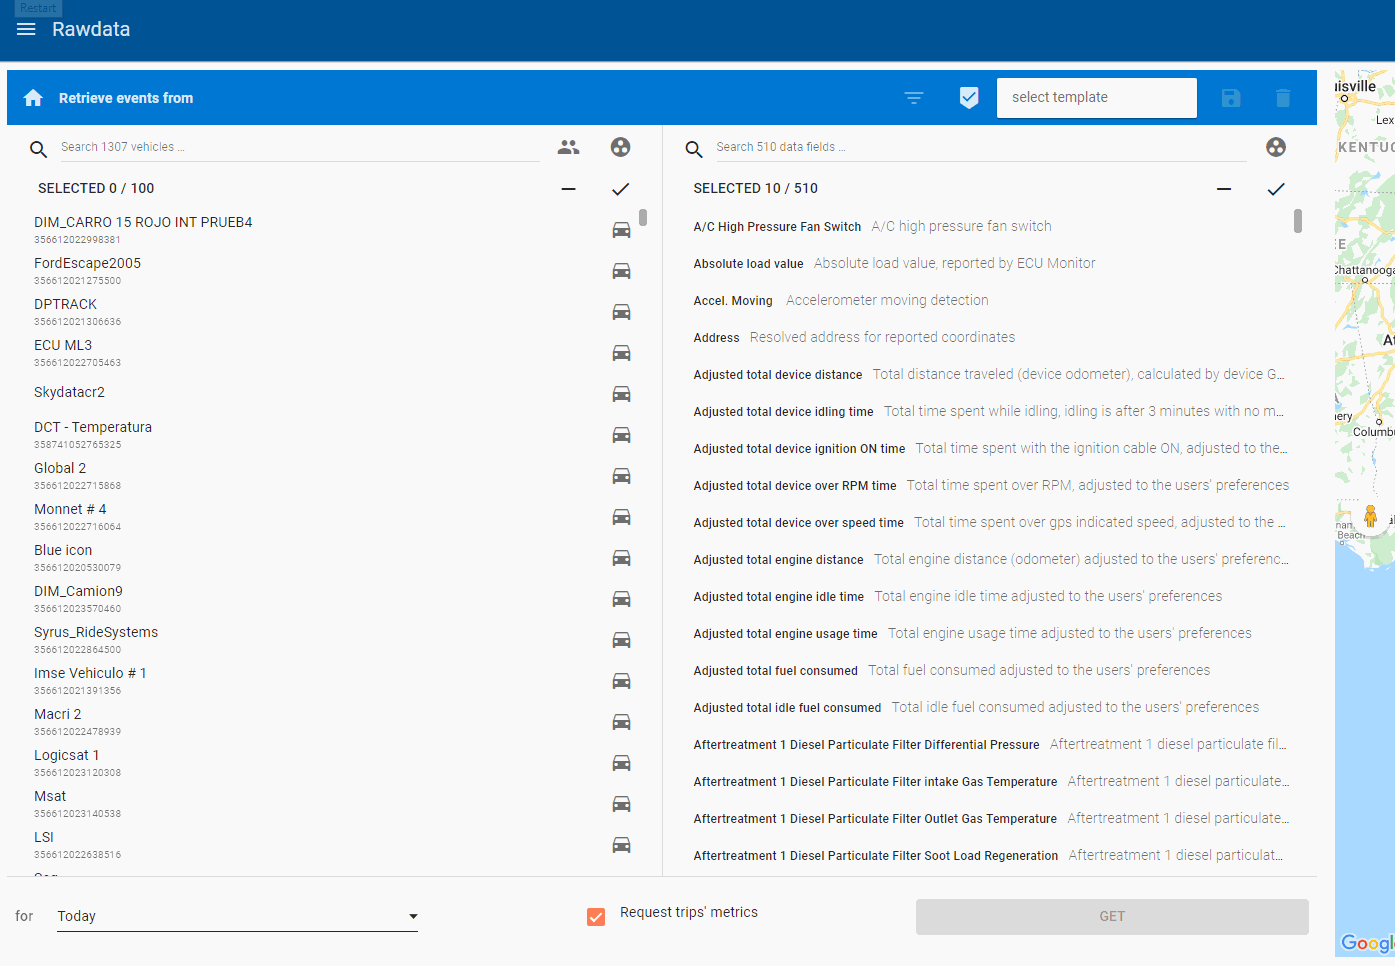
To generate a Rawdata report, navigate to the Rawdata module and select the vehicle or vehicles for which you want to generate the report. Choose the desired date or date range, and then click OK to generate the report on screen.

Parameters
There are more than 500 parameters you can filter for a report and out of those, there are 10 predetermined by default which are: Altitud, Event Code, Event Time, Label, Latitude, Longitude, Map URL, Speed, Valid Position, and Vehicle Name and You have the option to select and/or deselect any of them.*
*Parameters will show data as long as the data is reported by the devices
Heatmaps & Event Count
Once you run a rawdata report, you will have plenty of information including heatmps and event counts which will help with an easy and simple to-use yet powerful tool to diagnose any device reporting to Pegasus Gateway.
In the above example, we used Speed, Altitud, HDOP & RSSI parameters to visualize in the heatmaps along with the event counts at the bottom of the page, which you can choose from Event Label, Event Code, Event Count by Day, by Weekday and/or by Hour
Another example with heatmaps can be with the generation of driver behavior alerts, such as aggressive acceleration, hard braking, sharp curves, etc. With these events filtered, you can view them on a heatmap and really get an idea of where they occur.
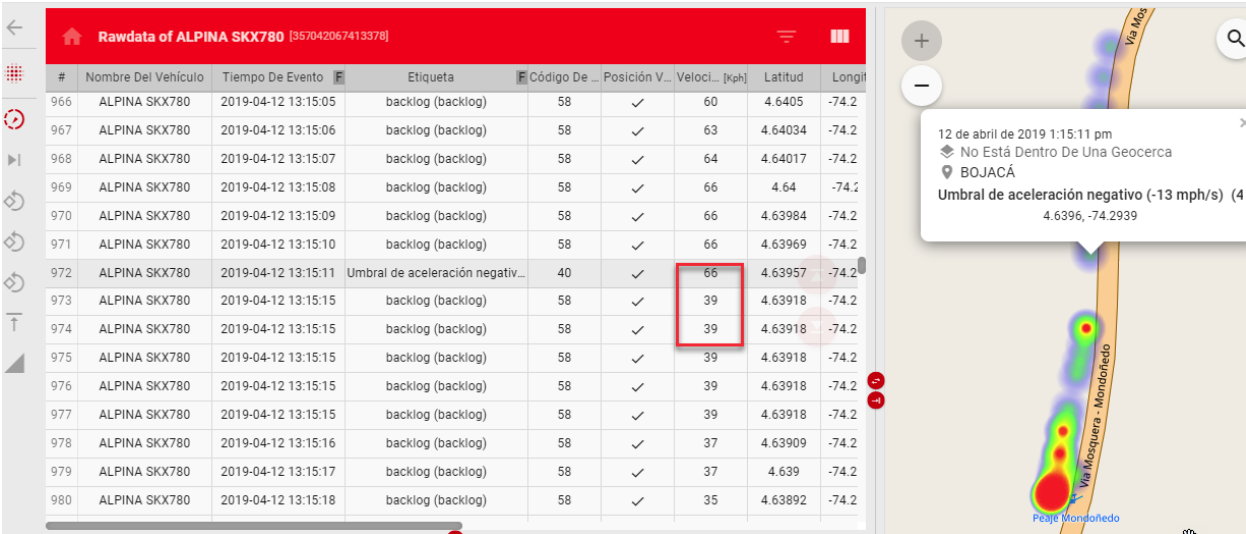
And possibly identify any causes or improvements based on the road conditions.

Column Visualization
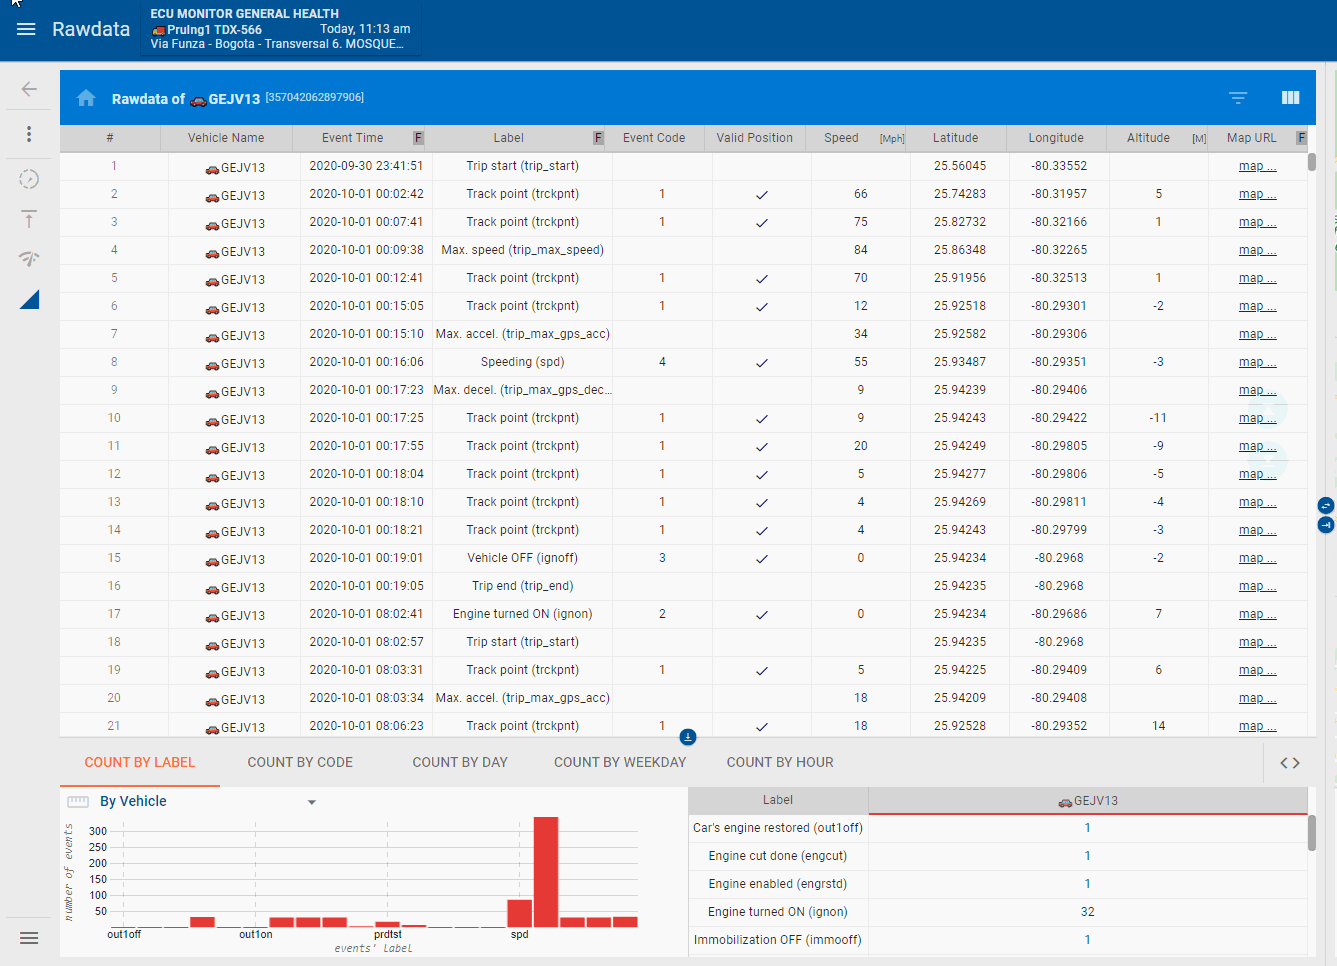
Once you run a report you have the option to hide columns to better analyze the data, to do this just click on the 3 vertical bars menu icon a the top right corner of the report, it will open a sub-menu listing the parameters in the current report, to hide a column, just click the eye icon to its right, then click the APPLY bottom (to visualize those parameters/columns again, just uncheck them.
Event Filters
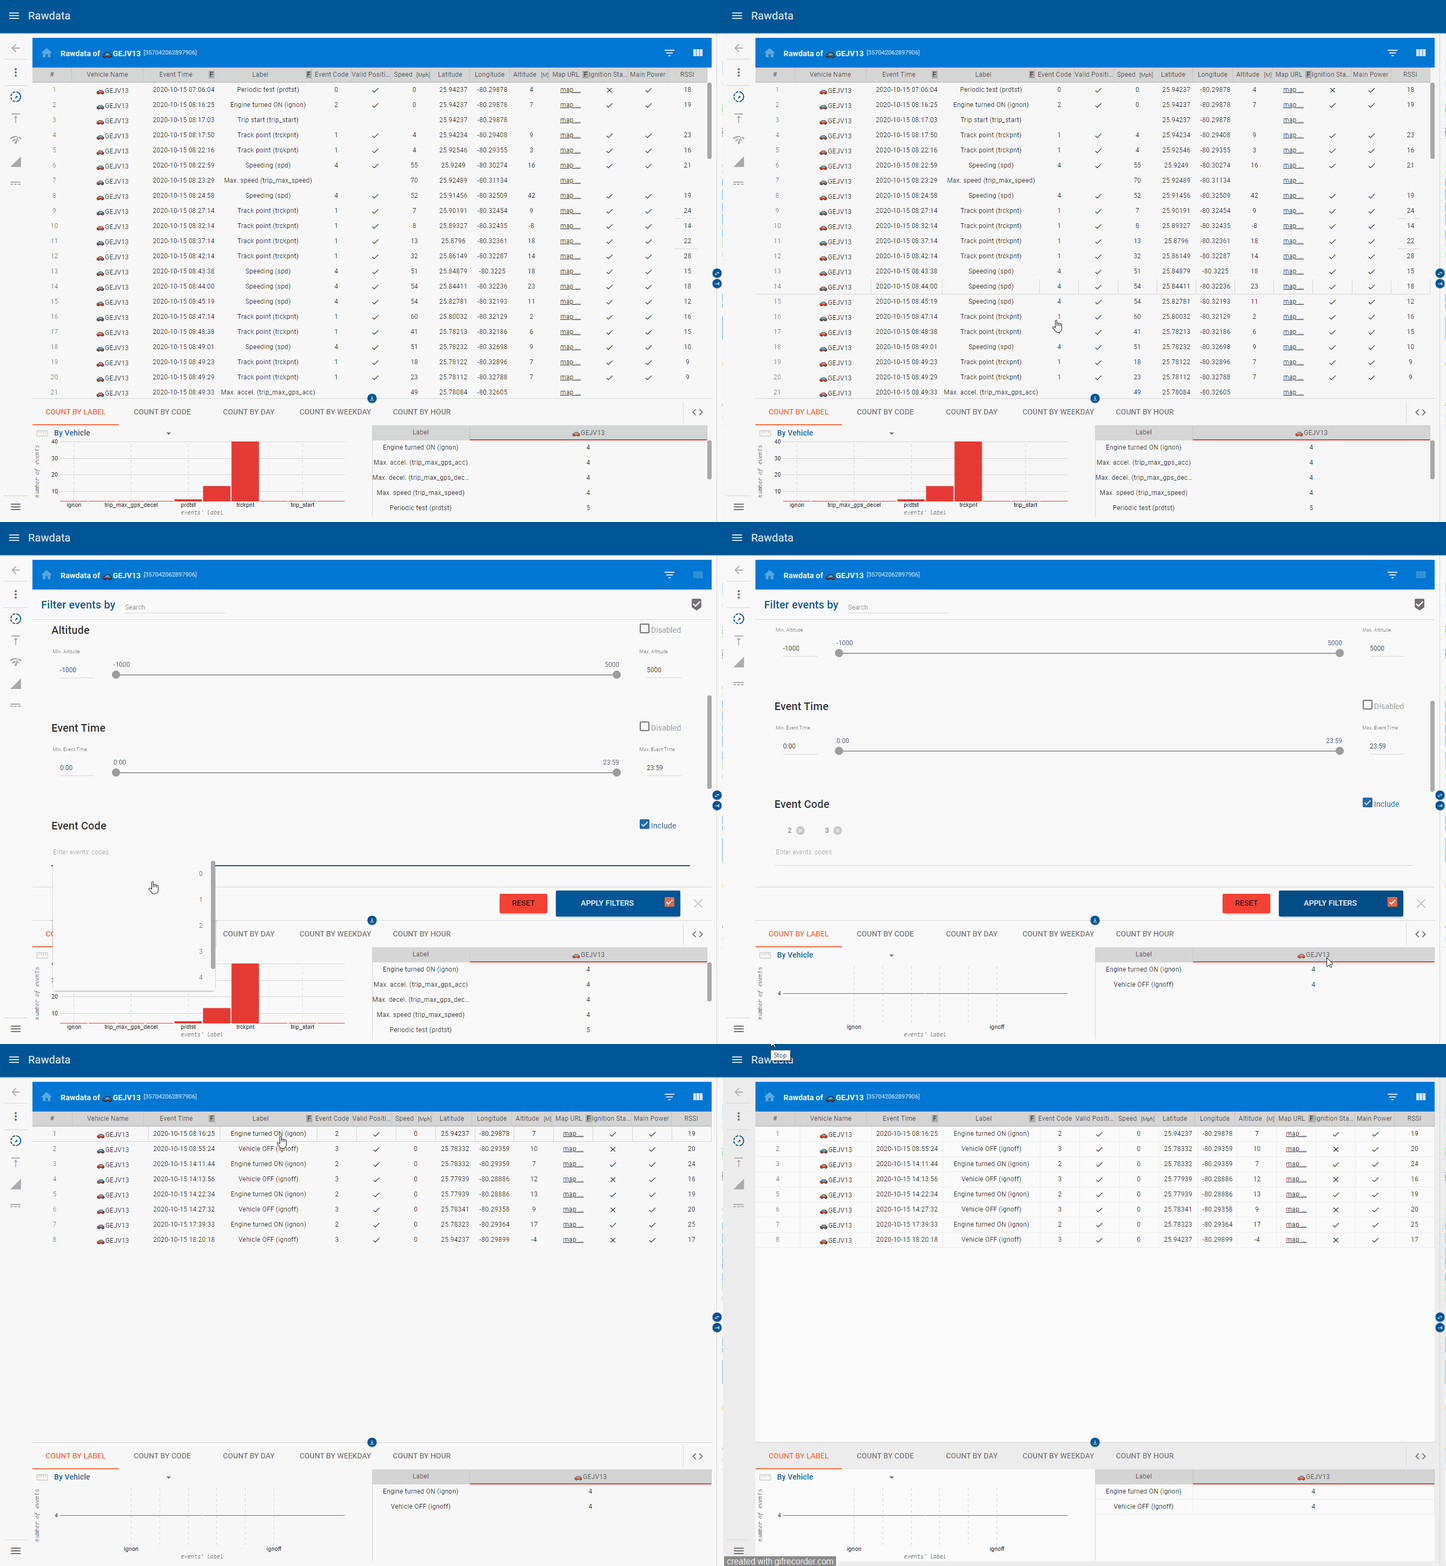
If you need to focus on specific events you can filter them to show only data for those events/parameters filtered. To do this you just need to click on the upside-down triangle filter icon at the top right corner of the report, this will take you to another screen where you can select what events and/or parameters to filter. In the below example, we are going to filter the ignition state parameter (Ignition ON/OFF).
Data Download
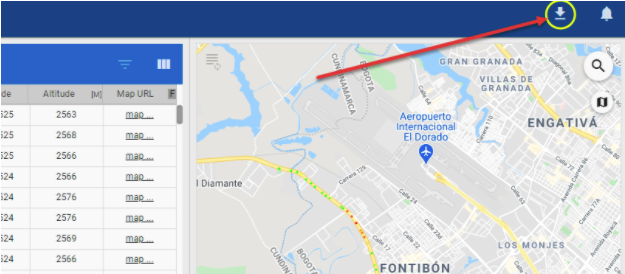
You can download the rawdata reports in a .csv format. To download the data, click the Download Data icon (Arrow pointing down) at the top right corner of the page.
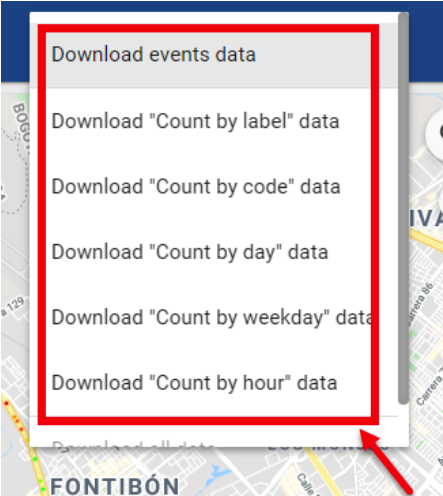
You will have the option to select what do you need/want to download, for example: events data, Count by label, Count by code, Count by day, Count by weekday and Count by hour data.
Report Templates
To facilitate the usage or the rawdata reports, we have templates available so you don’t have to select the parameters you normally use to run your reports.
Please note that these templates are saved locally on your computer’s browser, and if you switch computers or a new browser then the templates are not going to appear.
You can activate/deactivate the Template search box by clicking on the Pentagon icon at the top right corner of the report area.

With the rawdata you have 2 Templates already included: Default Fields & Basic Fields templates. You can add different customized templates with the parameters of your choice, for example we are going to use the Default Fields template as base and add 3 more parameters (Temperature/Analog Sensor A, Temperature/Analog Sensor B and Temperature/Analog Sensor C).
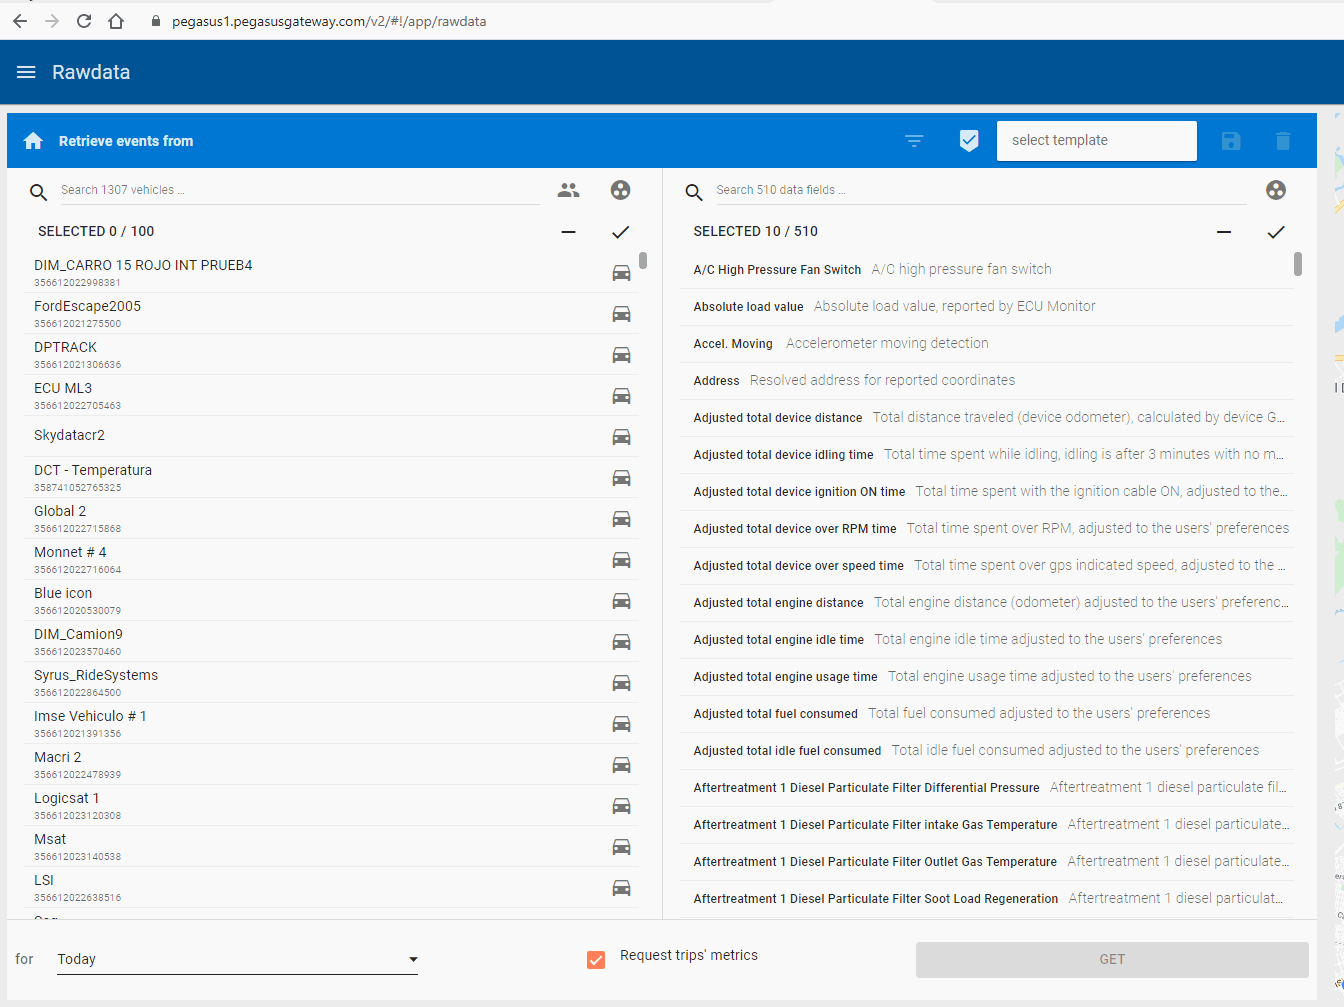
Once you select the parameters you want to add or delete, just click on the save icon (disk-shaped icon) at the right side of the template search box. To delete just click on the delete (trash can) icon on the right side of the save button.
Taurus Rawdata
You can obtain a report for the Taurus application rawdata, for this just click on the type of tracker device filter button, then search for a single Taurus device and/or multiple Taurus at the same time, select the date and/or date range you want to to get the report on.
HoS
You can obtain a report with the entity's HoS of each reported event.
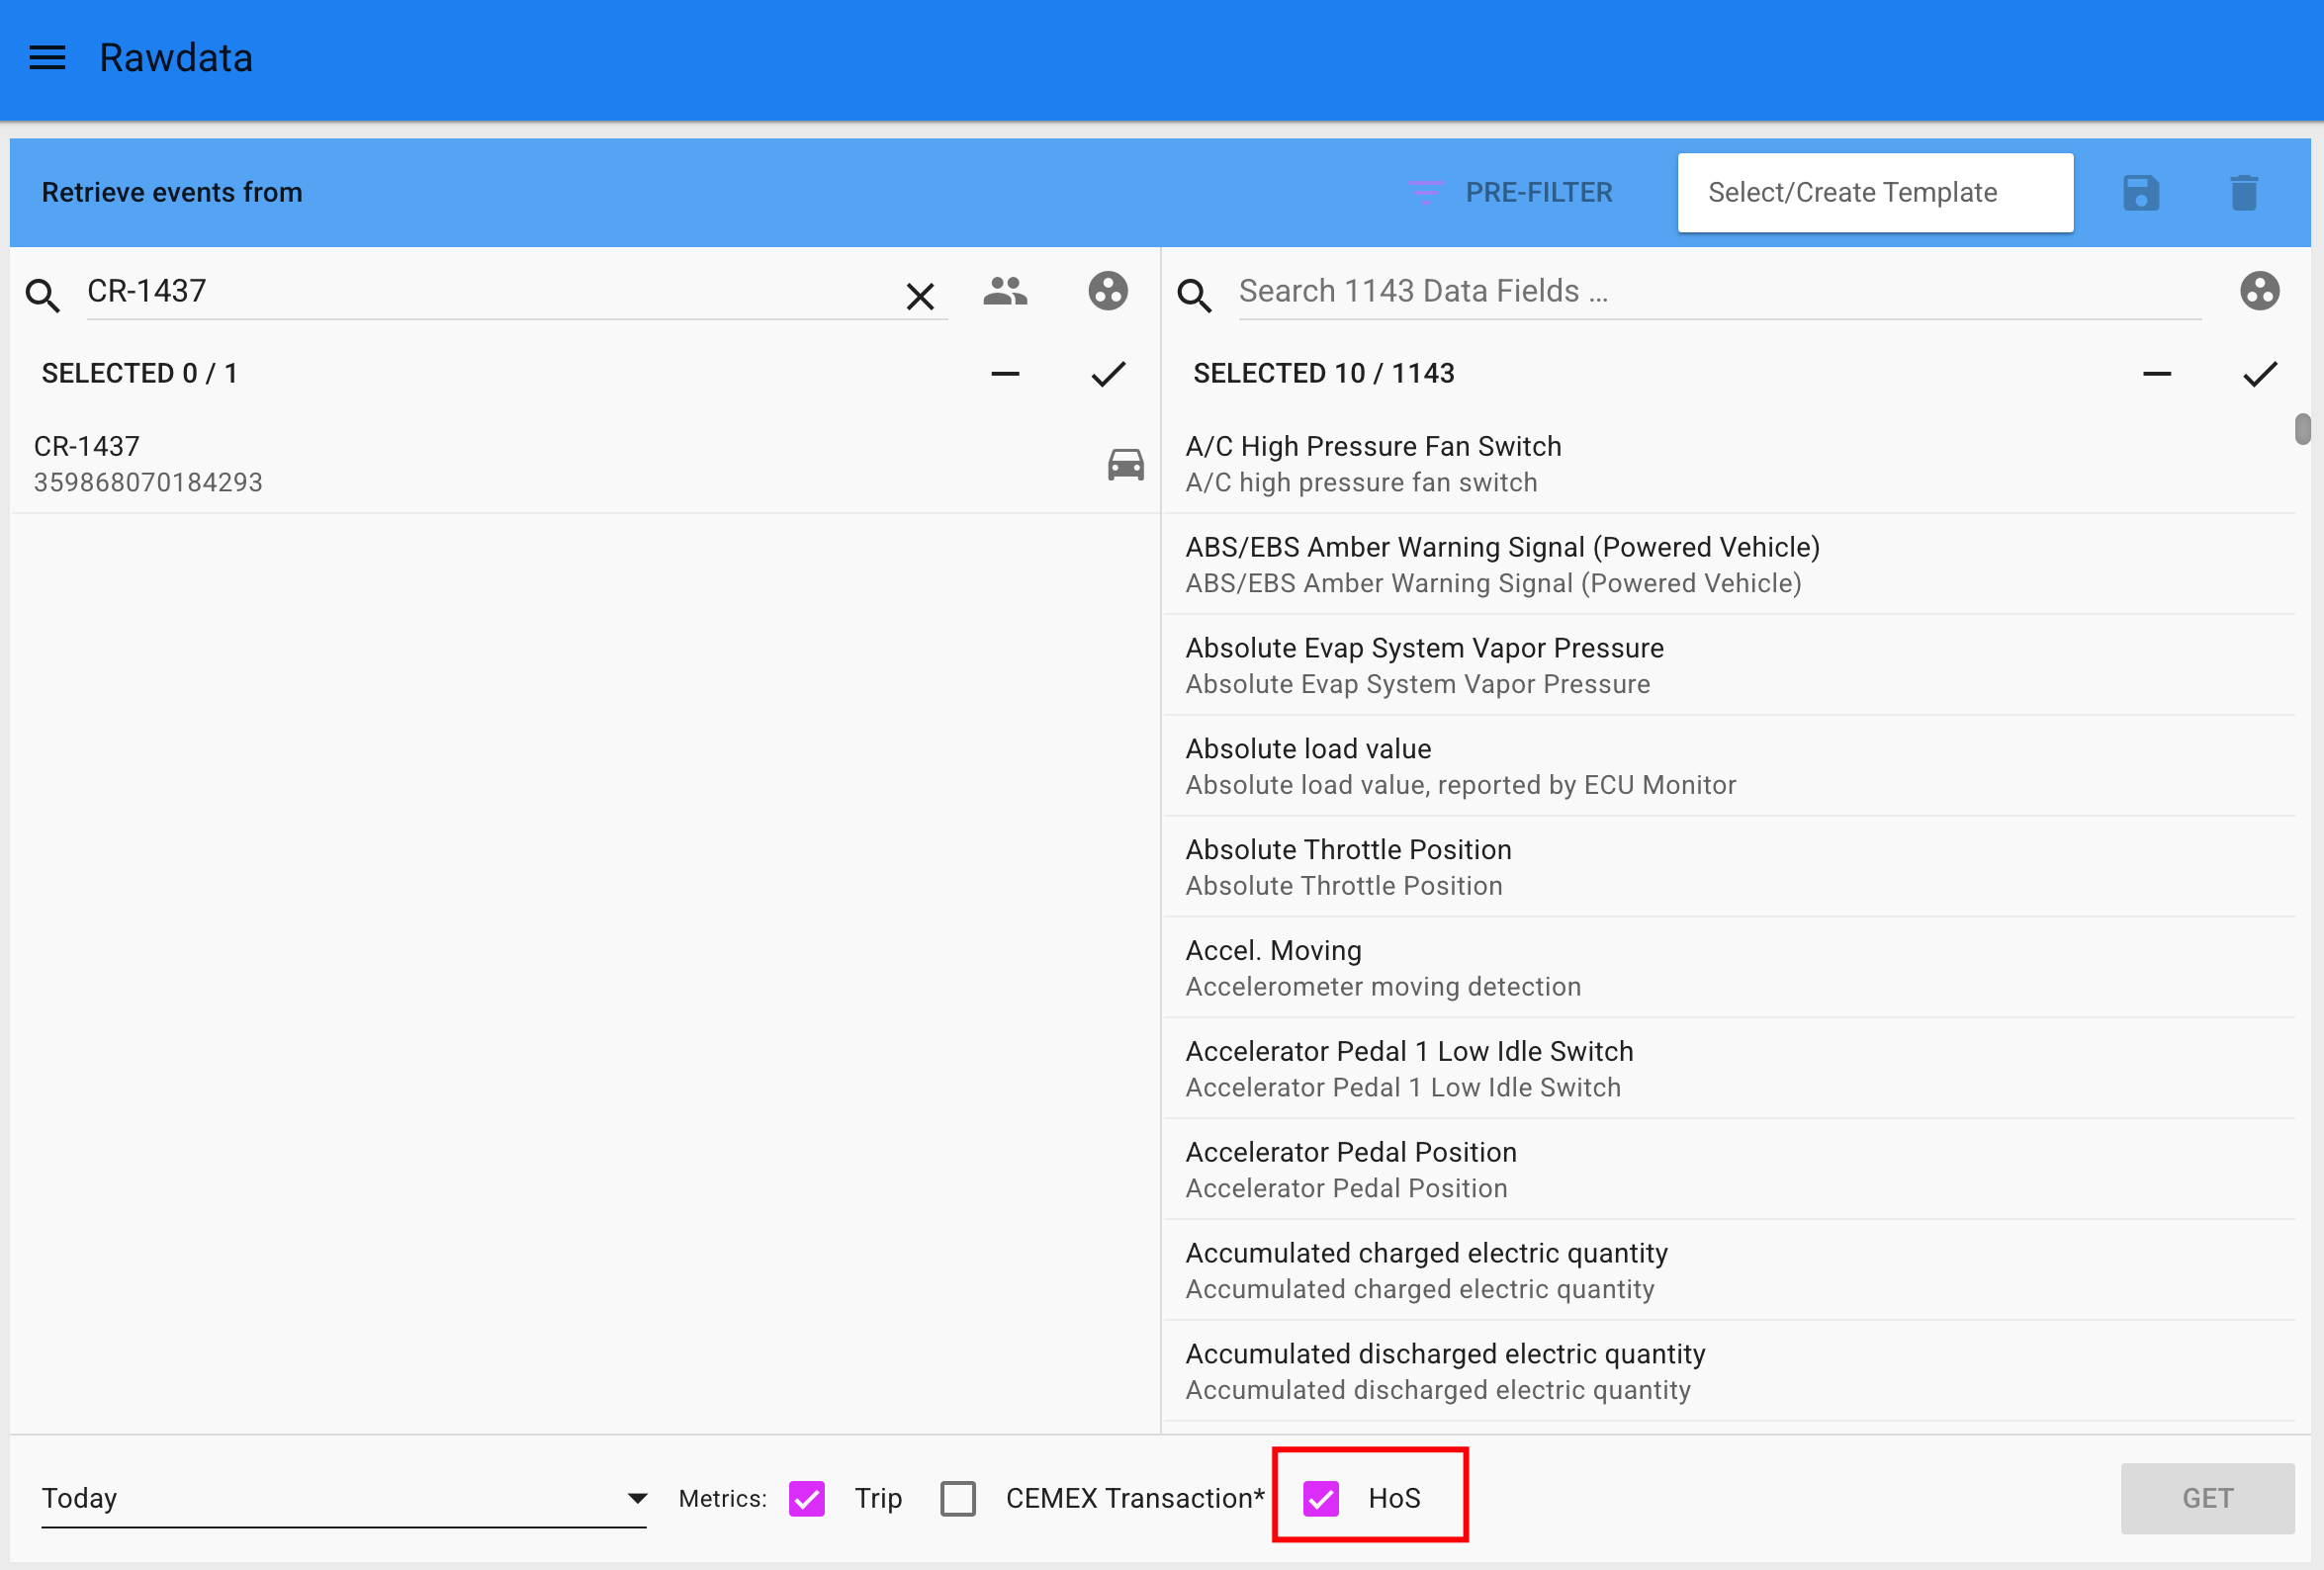
Working segment
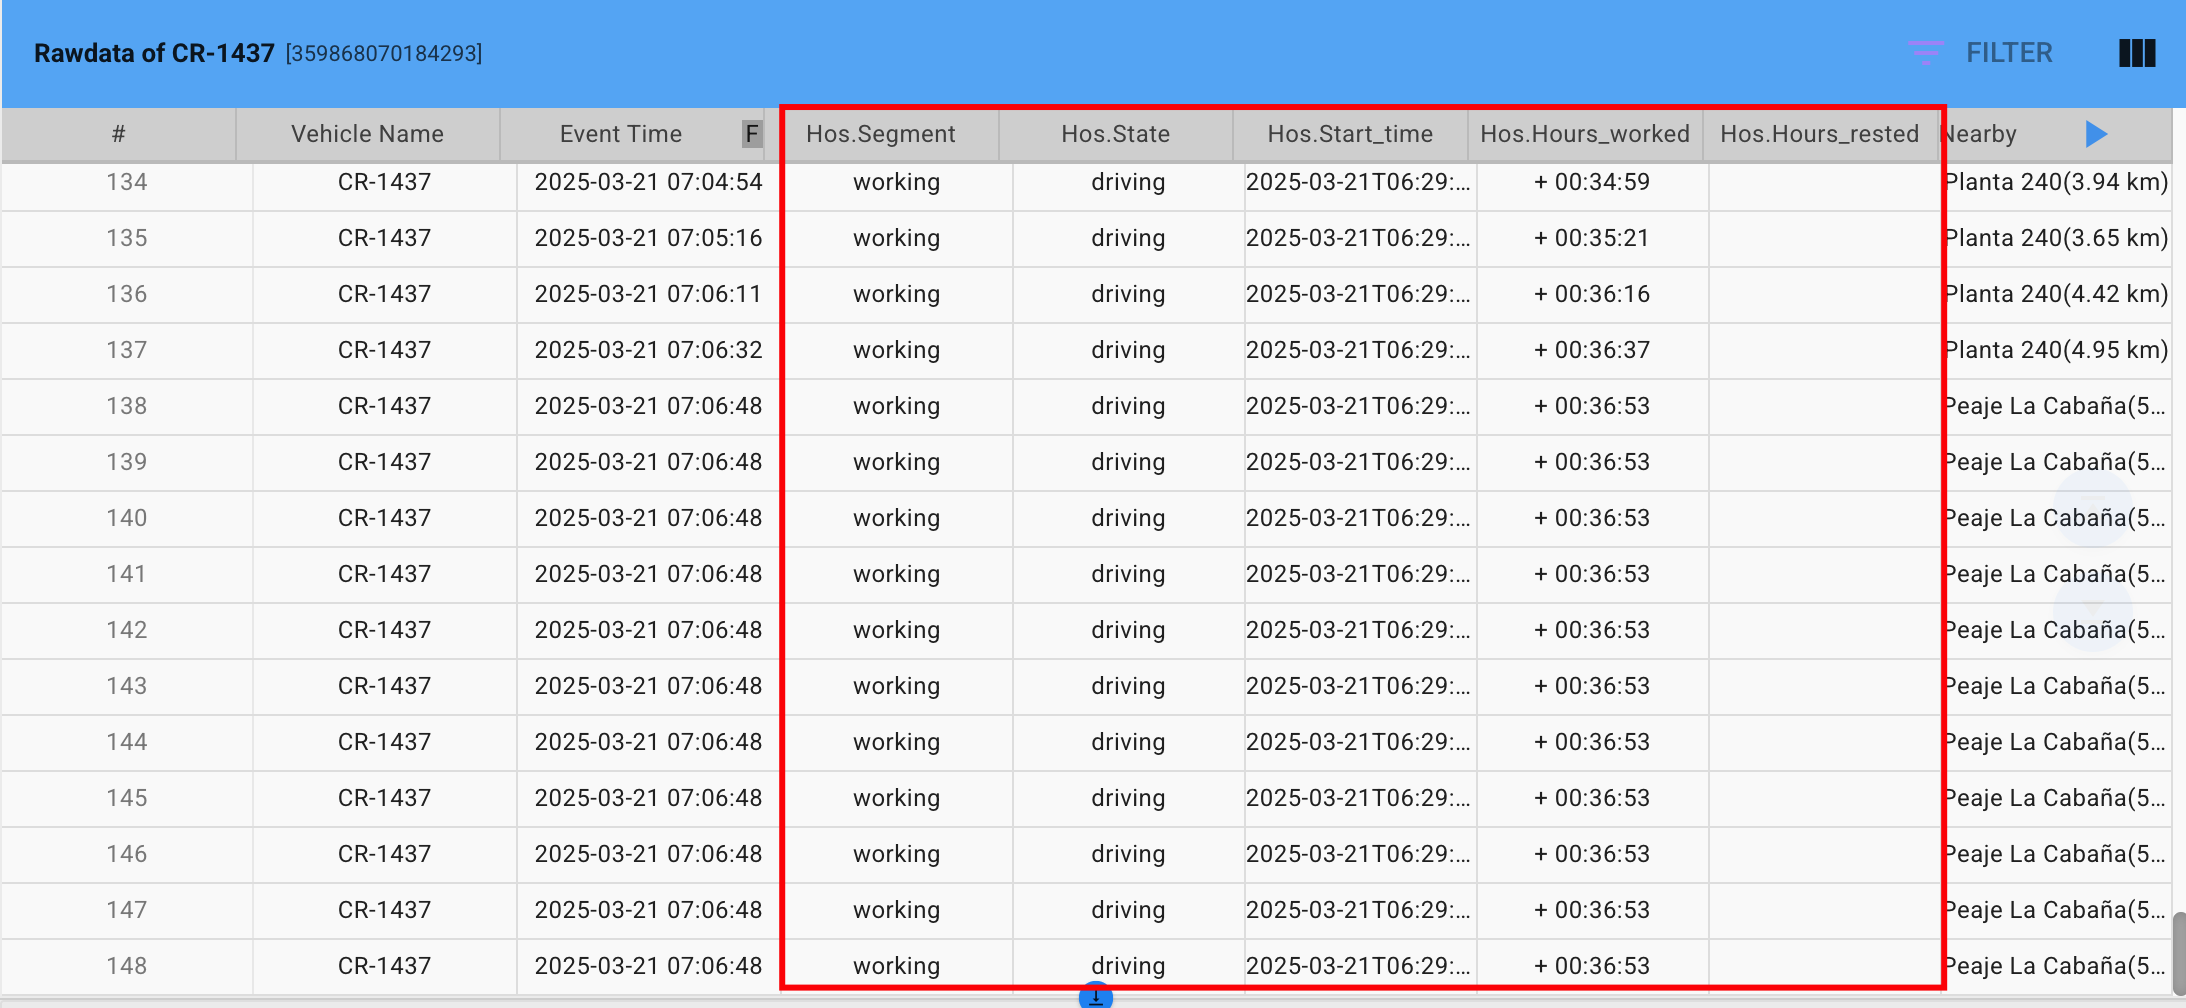
The report shows that the entity is currently in a working segment.
Hos.Hours_worked: hours worked by the entity
Working segment with a resting time
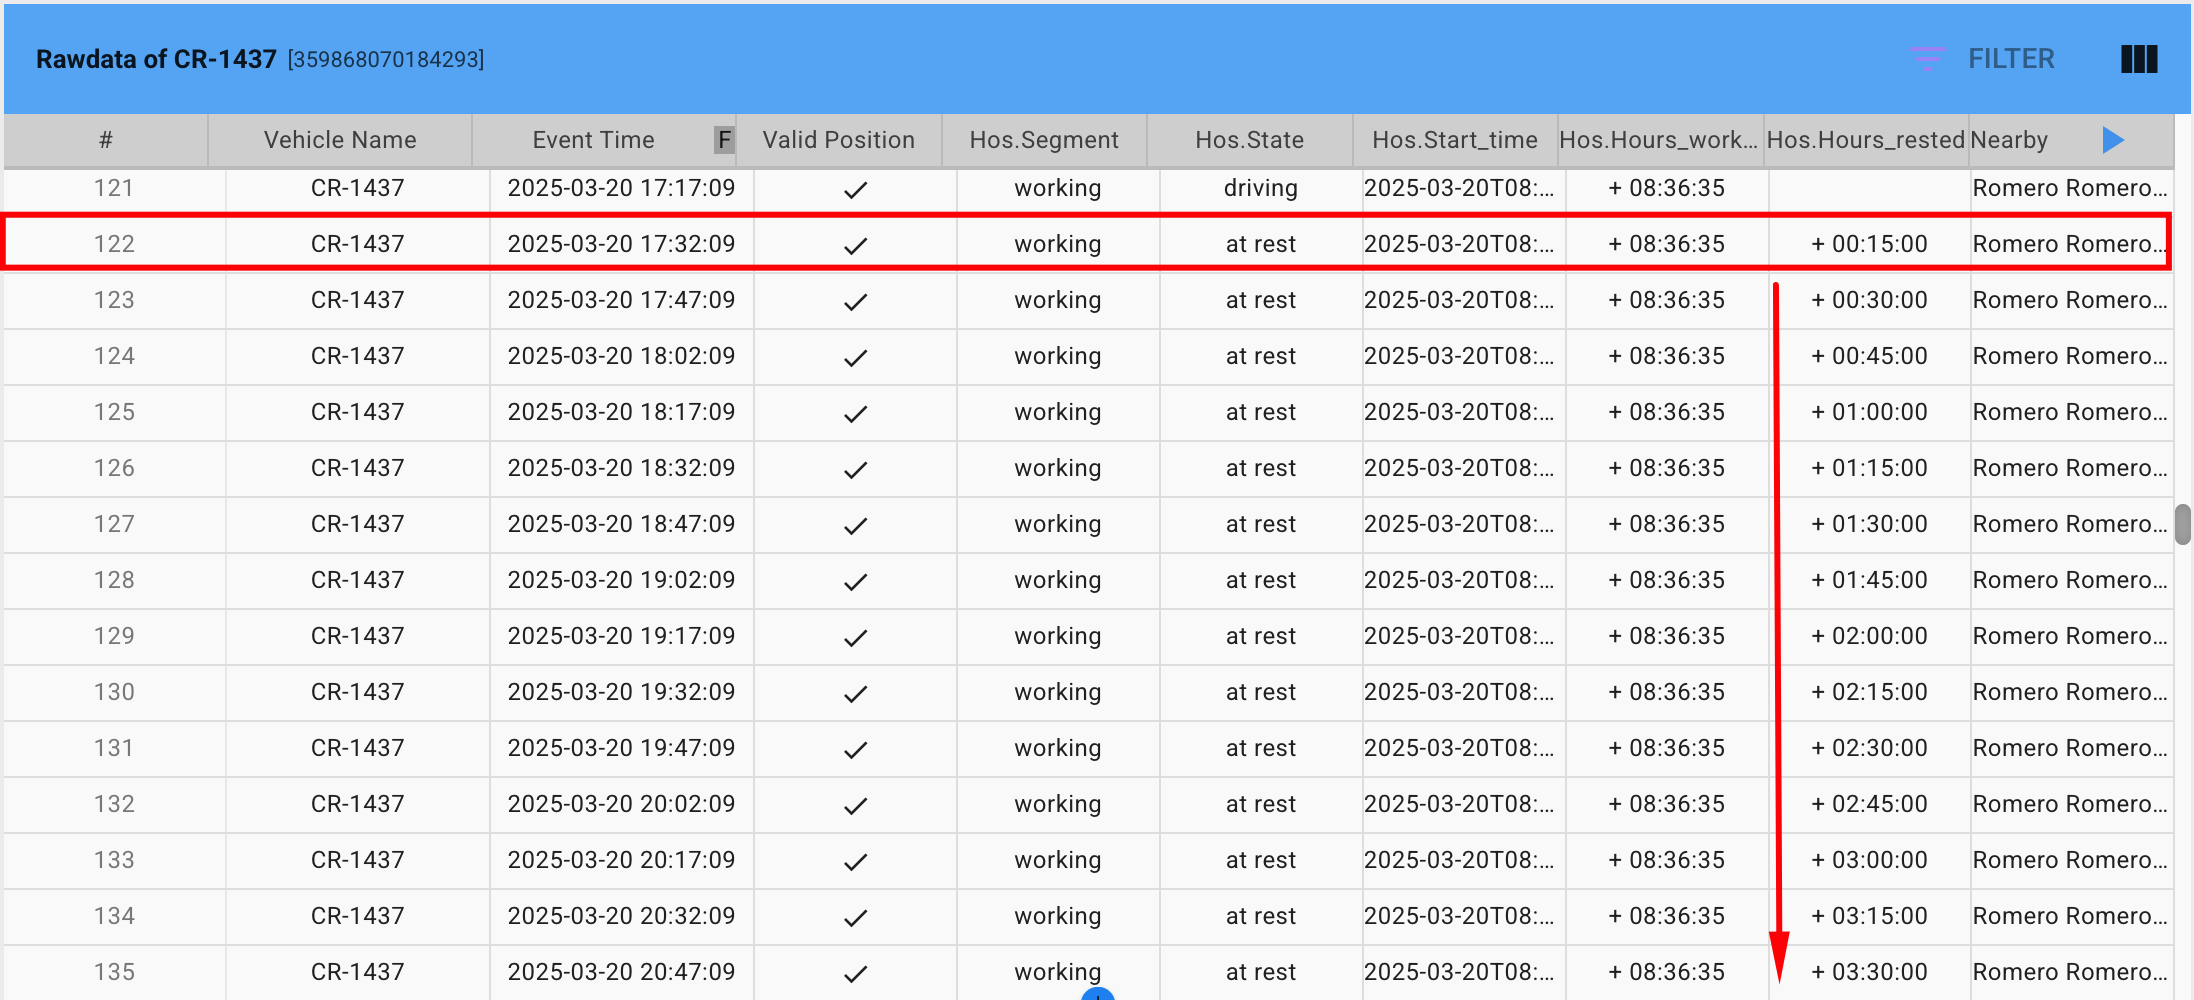
When the entity finishes its work day, in most cases, it turns off/stops the vehicle, and at that moment it begins to rest. At that point, it will be in its work segment until it remains parked for more than the minimum required time, then the work segment ends and the rest segment begins.
In this example the entity remains "at rest" for more than the minimum required, and this is why in the Hos.Hours_rested this time is recorded. The working end is at 2025-03-20 17:32:09.
Resting segment
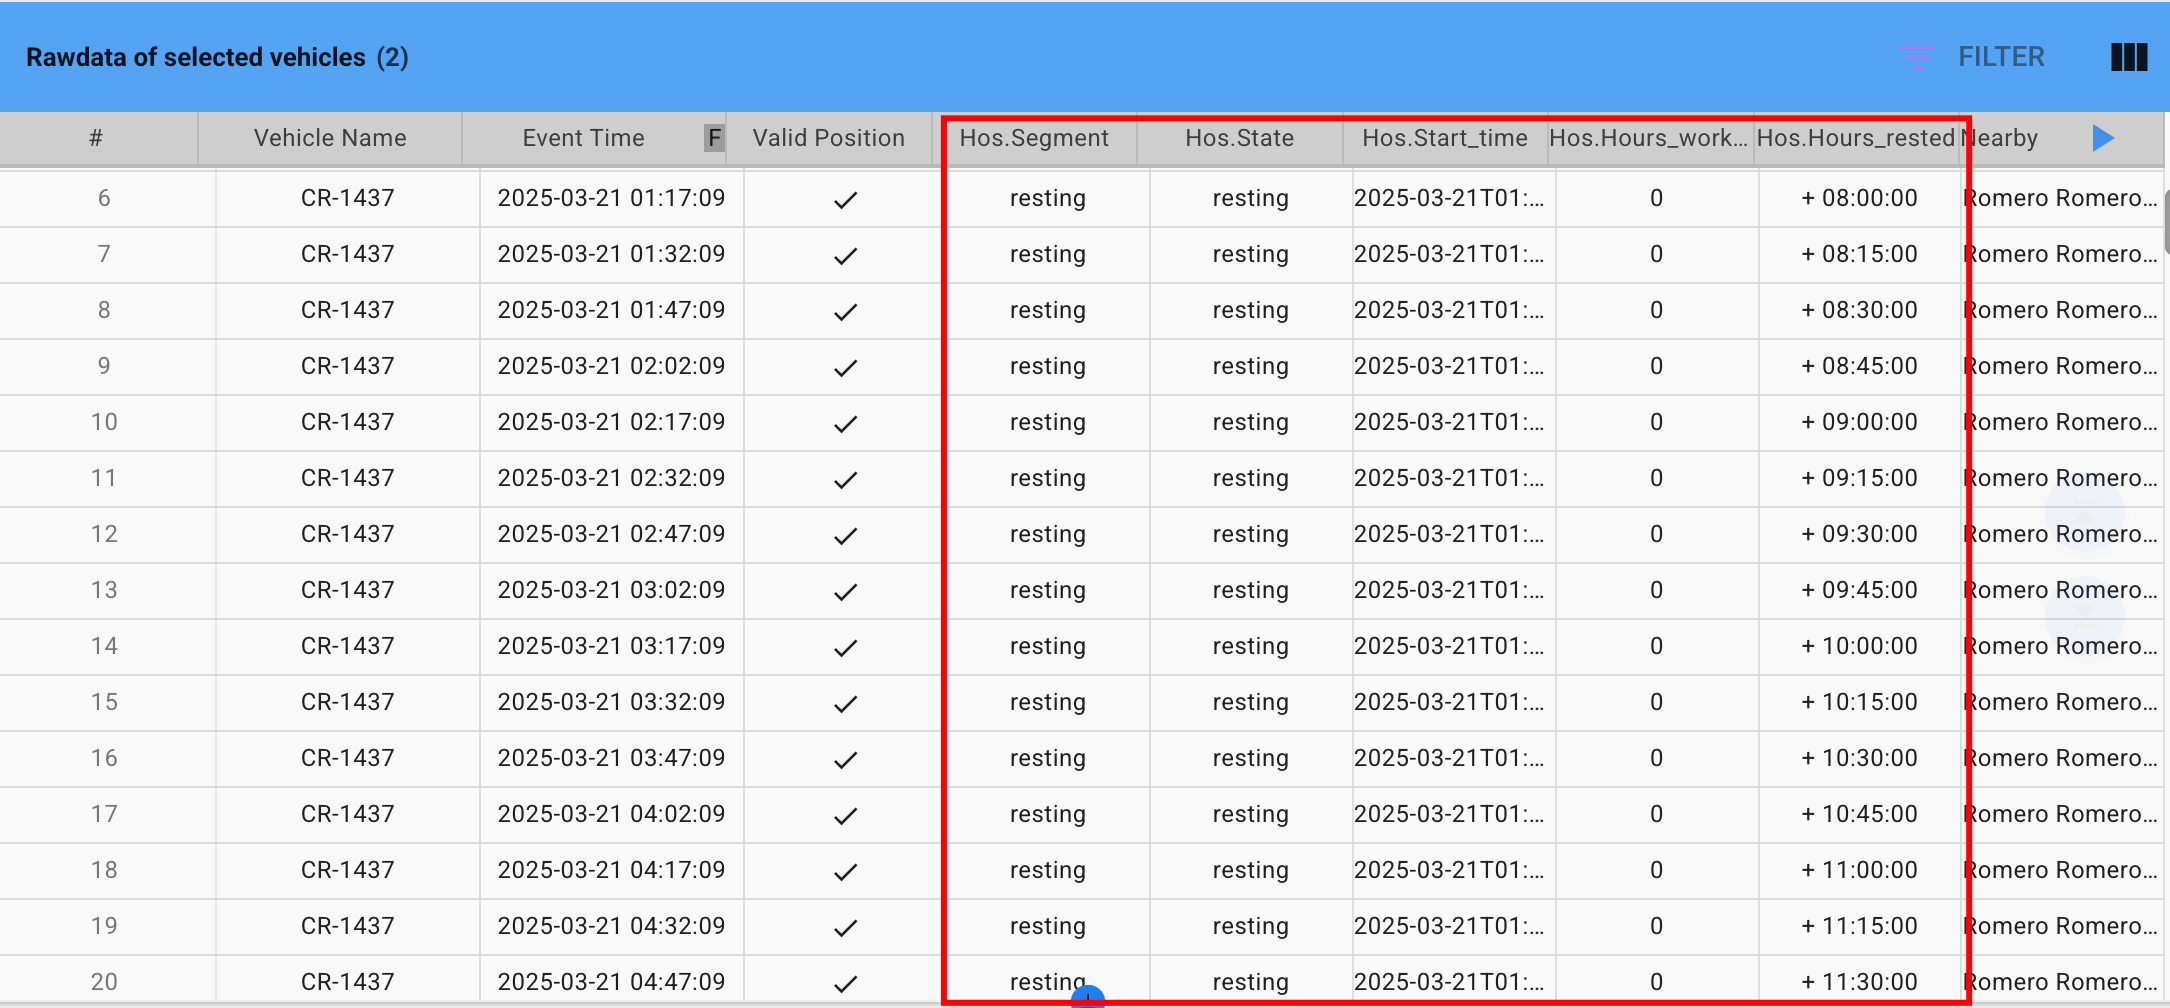
The Hos.Hours_work column remains at zero, as the entity has completed its work and is currently resting.
The Hos.Hours_resting column records the amount of time the entity remains resting.
Updated 6 months ago
