Easy Driver Score
Introduction
EasyDriverScore is a comprehensive tool leveraging telemetry, telecommunications technology, hardware, software, and advanced algorithms to detect moments indicative of poor driving habits. These habits can endanger the lives of drivers and others, increase environmental impact due to excessive or unnecessary fuel consumption, and reduce the useful life of vehicles.
EasyDriverScore is designed to assist in driver education by identifying and highlighting these poor habits in an easy-to-understand manner. It analyzes data obtained through GPS hardware, ECU readers via the CAN bus, and ADAS and DMS sensors.
The primary objective of EasyDriverScore is to assist companies with vehicle fleets, vehicle and cargo insurers, and anyone interested in enhancing safety and fuel efficiency. By identifying and correcting improper driving habits, EasyDriverScore helps reduce fuel costs, spare parts expenses, and fines, while also contributing to improved safety protocols and a reduction in traffic accidents.
EasyDriverScore identifies and detects habits such as the following:
Road Safety:
- Speeding
- Aggressive braking and acceleration
- Drowsiness: detecting driving while intoxicated
- Fatigue: detecting overworking
- Distraction
- Aggressive cornering
- Not wearing a seat belt
- Smoking, eating, or drinking while driving
- Not using turn signals when changing lanes
- Driving too close to other vehicles (tailgating)
Vehicle Misuse Leading to Excessive Wear and Fuel Consumption:
- Idling (having the engine running while the vehicle is stopped for long periods)
- Bad driving habits
- Over-revving
- Clutch misuse
- Excessive braking
- Aggressive use of the accelerator pedal
- Misuse of the gearbox
Operation:
EasyDriverScore utilizes the following to assess drivers:
- Identification: Various methods can be employed to identify a driver, ranging from hardware such as RFID and iButtons to manual identification via the Pegasus Gateway Monitoring platform. Identification is optional and serves to evaluate drivers who use different vehicles. When a single driver is assigned to a single vehicle, identification is optional.
- Distance Traveled: Measuring the distance traveled is crucial for assessing the impact of poor driving habits. This metric provides quantifiable data on the extent to which a vehicle has been driven under conditions influenced by adverse driving practices.
- Ignition Time: Measuring the duration for which the engine remains running while the vehicle is stationary is essential for evaluating the impact of ignition time on driving habits. This metric quantifies instances where drivers unnecessarily idle their engines, contributing to increased fuel consumption, emissions, and engine wear.
- GPS: Through any GPS device, EasyDriverScore detects the following Types of Events:
- Aggressive Accelerations: Accelerating more than 11 km/h within one second is considered aggressive driving, indicating unnecessary fuel consumption.
- Hard Brakings: Decreasing speed by more than -12 km/h within one second is classified as hard braking, indicating aggressive driving due to issues such as speeding, distraction, or following too closely.
- Aggressive Turns: Executing an open curve (50° to 70°) or a sharp curve (70°+) at speeds exceeding 24 km/h and 50 km/h respectively is considered aggressive turning. Such maneuvers pose risks of skidding and rollover.
- Idling Events: Being stationary with the engine running for more than 5 minutes signifies unnecessary fuel consumption.
- Speeding Detected by GPS: Speeding incidents detected based on GPS device settings, used to alert excessive speeds for various vehicle types or critical operational points such as hazardous curves, when combined with geofencing configurations in the GPS device.
- Speeding Events Detected via Road Speed Limits: Exceeding posted speed limits read from private sources or crowdsourcing:
- Moderate Speeding: Exceeding the road speed limit by more than 10 km/h but less than 20 km/h, based on the actual published limit.
- Severe Speeding: Exceeding the road speed limit by more than 20 km/h but less than 30 km/h, based on the actual published limit.
- Critical Speeding: Exceeding the road speed limit by more than 30 km/h, based on the actual published limit.
- Events Read from the ECU: When incorporating data readings obtained via CAN bus from the Engine Control Unit (ECU) of vehicles, the following parameters can also be analyzed:
- Green Zone Driving Analysis: Refers to driving within the established RPM range deemed appropriate for engines, avoiding both under-revving and over-revving.
- Events Detectable by RPM Abnormalities:
- Coasting: Having low revolutions while moving is equivalent to going downhill with the gear in neutral.
- Excessive RPM and Low Torque: Low torque with high RPMs imply improper use of engine gears.
- Excessive RPMs in Motion: Excessive revs in motion may be due to misuse of the gearbox or aggressive driving.
- Excessive RPMs Idling: Excessive RPMs at idle can be related to the use of PTO, but it may also be improper use of the accelerator pedal when stopped.
- Overconsumption: Having a fuel consumption of more than 1.5% of the tank percentage in less than 30 seconds.
- High RPM and Load Above 15%: The revolutions should drop as the engine load increases. High RPM with a load of more than 15% implies improper use of engine gears.
- Brake Assist at Wrong RPMs: The engine brake must not be applied at low revolutions.
- ABS Activated at More Than 30 km/h: Activating ABS while moving involves sudden braking as seen from the engine.
- Events Detectable by Incorrect Pedal Use:
- Brake Pressed for More Than 10 Seconds in Motion: Long braking in motion causes wear of brake pads and discs, and unnecessary fuel consumption.
- Immediate Acceleration When Starting the Engine: Accelerating a vehicle right after starting it can lead to insufficient lubrication, premature engine wear, damage to the exhaust system, increased fuel consumption, and safety risks.
- Clutch for 10 Seconds with No Brake and Speed Less Than 2 km/h: When stopped, the vehicle must be put in neutral, press the brake, and release the clutch. Not releasing the clutch generates unnecessary wear on the clutch discs.
- Clutch Overload: Engine brake activated and clutch at more than 50%.
- Clutch Pressed for More Than 20 Seconds While Moving: It generates wear on the clutch discs and represents fuel waste.
- Clutch Pressed for More Than 30 Seconds at Stop: It generates unnecessary wear on the clutch discs.
- Events Detected by DMS:
- Fatigue Alert: Driver fatigue or drowsiness has been detected.
- No Driver: The camera does not detect the driver. This may be due to a change in position or obstruction caused by manipulation of the camera.
- Distraction: The driver stops looking ahead for prolonged periods.
- Telephone Use: Detection of phone use while driving.
- No Seatbelt: The driver is not using the seatbelt.
- Smoking Alert: The driver is smoking while driving.
- Food and Drinks: Consuming food and drinks while driving.
- Camera Tampering: Manipulation of the camera or its SIM card.
- Events Detected by ADAS:
- Forward Collision Warning: Risk of collision with a vehicle, pedestrian, or object in front.
- Vehicle in Front Too Close: Driving too close to the vehicle in front.
- Left Lane Departure Without Blinker: The driver does not use the turn signals to change to the left lane.
- Right Lane Departure Without Blinker: The driver does not use the turn signals to change to the right lane.
- ADAS Speed Limit Exceeded: The road speed limit detected by the camera was exceeded.
- Aggressive Lane Change: Aggressive lane change.
General Scoring Formula EasyDriverScore:
Having explained the factors affecting operation, as well as the events that identify poor driving habits, the formula used to score drivers is described below:
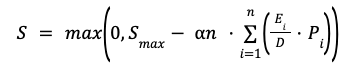
Where:
S= Score
Ei= Event type (Event types described in "Operation" Section)
D = Distance
Pi = Weighting Factor (It's a number from 0 to 10 that can be configured by the user
according to their preferences in the "Settings" tab of the application.)
= Correction Factor
n = Event types number_
EasyDriverScore Accident Risk
Accident Risk Probability by Severity
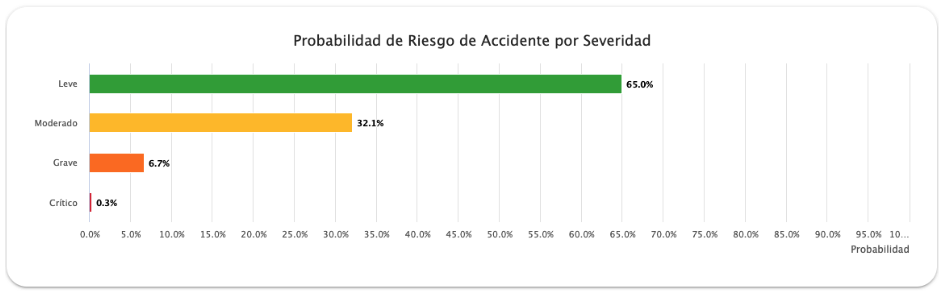
Indicates the predictive percentage risk of the 4 different types of accidents that a driver could have, based on their driving events and distance traveled. The explanation of the 4 possible accident types evaluated is found below.
Accident Risk Trends
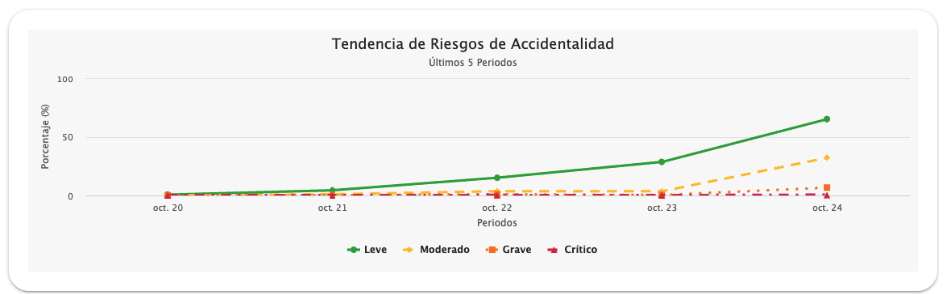
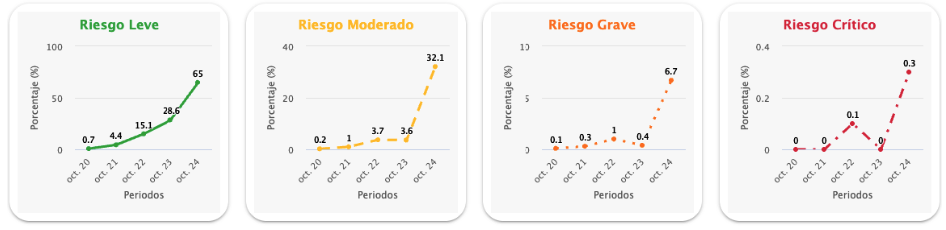
Shows the historical accident risk trends of the driver, comparing the last 5 periods with the current one.
Accident Risk History by Entity
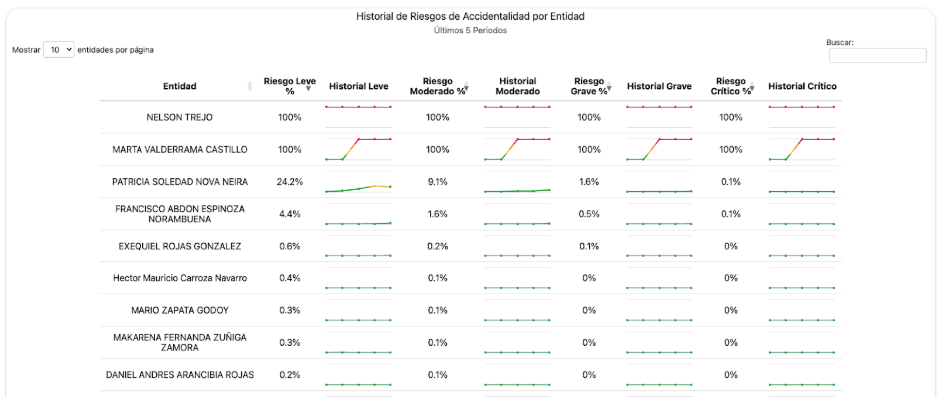
Shows the accident risk history of each driver in a group over the last 5 periods, organized from highest to lowest risk for easy identification of drivers who should be warned or trained as a priority.
Accident Type Classification
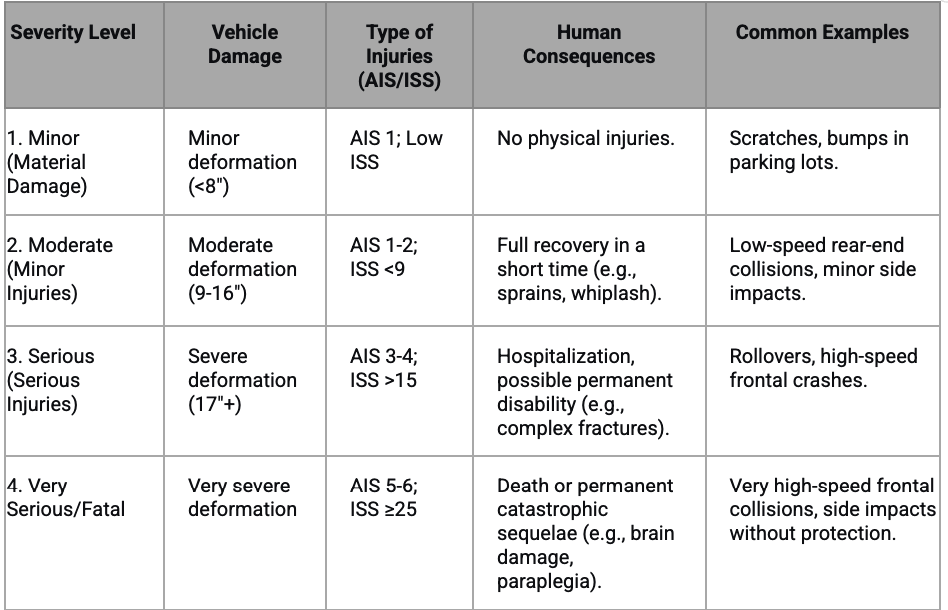
AIS: Abbreviated Injury Scale
ISS: Injury Severity Score
Accident Risk Probability by Severity
Indicates the predictive percentage risk of the 4 different types of accidents that a driver could have, based on their driving events and distance traveled. The explanation of the 4 possible accident types evaluated is found below.
- Material Damage Accidents (Minor Severity)
Incidents where the impact is low-energy. Only damage to vehicles or properties involved occurs, such as dents, broken lights, or scratches on the bodywork.
Key Characteristics:
No physical injuries to people occur.
The impact force (Delta-V) is low, often associated with crush damage of less than 8 inches, suggesting a sudden deceleration equivalent to a low speed change (about 5 km/h).
These are typically low-speed collisions, such as bumps in parking lots or rear-end collisions in traffic jams.
Examples: Scrapes while parking, very low-speed rear-end collisions without injuries. - Accidents with Minor Injuries (Moderate Severity)
Incidents where the impact is moderate. Result in non-disabling injuries that require medical attention but allow full recovery in a short period.
Key Characteristics:
Injuries such as sprains, whiplash, bruises, hematomas, or minor lacerations.
According to the Abbreviated Injury Scale (AIS), they are classified as severity 1 (minor).
Temporary disability is usually brief or non-existent.
Vehicle crush can be between 9 and 16 inches, indicating more significant deceleration.
Examples: Side impacts at intersections at moderate speed, rear-end collisions that deploy the airbag but do not cause serious trauma. - Accidents with Serious Injuries (High Severity)
High-energy collisions that cause serious bodily injuries, requiring immediate hospitalization and surgical or ICU treatment. There is a vital risk and high probability of permanent sequelae.
Key Characteristics:
Injuries such as complex fractures, conscious traumatic brain injuries (TBI), internal bleeding, or organ damage.
On the AIS scale, they correspond to severity levels 3 (serious) and 4 (severe).
The Injury Severity Score (ISS) is usually above 15, indicating polytrauma.
The vehicle typically shows severe crush (more than 17 inches), indicating very high impact forces.
Consequences: Prolonged temporary disability and high probability of permanent disability (e.g., loss of mobility in a limb, chronic organ damage).
Examples: Rollovers, high-speed frontal crashes, side impacts against poles or trees, pedestrian collisions at medium-high speed. - Accidents with Very Serious or Fatal Injuries (Very High/Critical Severity)
The most devastating accidents, with extreme impact forces that exceed the protective capacity of vehicles. Generally result in immediate or short-term death, or catastrophic injuries with very severe permanent sequelae.
Key Characteristics:
Injuries with an AIS score of 5 (critical) and 6 (maximum, currently untreatable), such as severe traumatic brain injuries with low Glasgow score, spinal cord section, traumatic amputations, or massive polytrauma.
The ISS score is very high (≥25), associated with low survival probability.
Vehicle deformation is extreme, often with intrusion into the passenger compartment.
Consequences:
Mortality: Death at the scene or during transport to the hospital.
Survival with catastrophic sequelae: Injuries causing severe permanent disability (e.g., paraplegia, irreversible brain damage, multiple organ loss), requiring constant care and greatly altering quality of life.
Examples: Very high-speed frontal collisions, collisions with heavy vehicles (trucks), side impacts without protection, multiple rollovers, high-speed pedestrian collisions, and road departures with violent impact against fixed obstacles.
Driving Events Used to Calculate Statistical Accident Risk in EasyDriverScore:
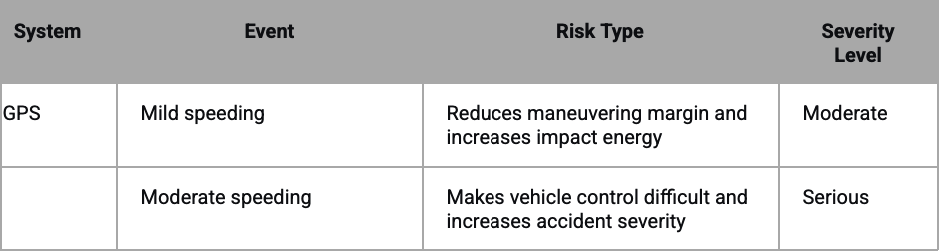
GPS Events
Mild Speeding
Risk Detected: Exceeding the speed limit by more than 10 km/h and less than 20 km/h.
Why it's Dangerous: Although it seems "mild," this excess already compromises safety. It significantly increases braking distance and reduces the driver's field of vision, making it harder to detect lateral hazards like pedestrians at intersections. In a collision, the released kinetic energy is much greater, increasing the probability of serious injuries.
Moderate Speeding
Risk Detected: Exceeding the speed limit by more than 20 km/h and less than 30 km/h.
Why it's Dangerous: This level of speeding represents a high and evident risk. The vehicle becomes considerably harder to control in curves or with changes in road surface. The braking distance becomes extremely long, and the probability of the driver losing control in an evasive maneuver or the accident being fatal increases exponentially.
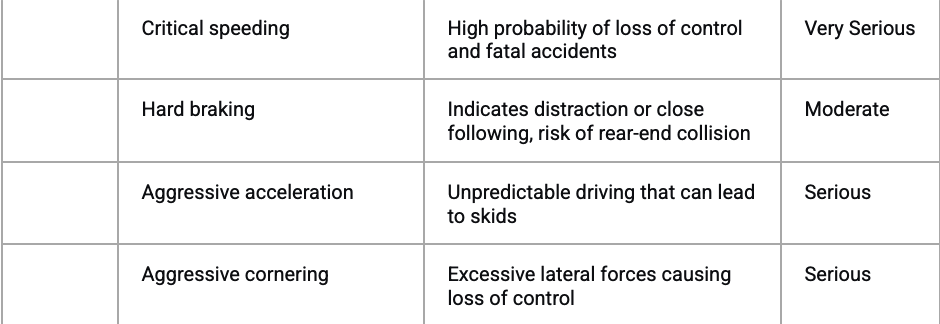
Critical Speeding
Risk Detected: Exceeding the speed limit by more than 30 km/h.
Why it's Dangerous: This is extremely high-risk and deliberately dangerous behavior. At these speeds, the driver has very limited control over the vehicle. Any irregularity in the pavement, crosswind, or mild curve can cause a rollover or uncontrollable skid. In case of collision, the fatality rate is extremely high due to the involved impact forces.
Hard Braking
Risk Detected: Violent decelerations caused by pressing the brake very hard and suddenly.
Why it's Dangerous: Indicates the driver was not anticipating traffic or road conditions. It's a delayed reaction to a hazard, meaning they were already in a near-accident situation. Additionally, it greatly increases the risk of the following vehicle rear-ending due to the unexpected hard braking. It's a clear symptom of distraction (e.g., phone use) or following too closely (tailgating).
Aggressive Acceleration
Risk Detected: Rapid and sudden increases in speed, pressing the accelerator to the floor unnecessarily.
Why it's Dangerous: Demonstrates impulsive and unpredictable driving. When accelerating aggressively, especially in urban environments, reaction time is reduced for pedestrians, cyclists, or vehicles that might cross unexpectedly. It also causes increased tire and component wear, and can easily lead to critical speeding in a very short time.
Aggressive Cornering
Risk Detected: Taking curves at excessive speed, generating high lateral G-force that challenges the vehicle's adhesion physics.
Why it's Dangerous: It's one of the main causes of rollovers and road departures. When a vehicle takes a curve too fast, the tires can lose traction (oversteer or understeer), throwing the car off the road and potentially causing it to roll over. This risk is amplified in trucks and high vehicles with a high center of gravity. It indicates a misjudgment of road conditions and the vehicle's own capabilities.
DMS Events
Fatigue
Risk Detected: The driver is not in physical condition to operate the vehicle safely. Their reflexes are extremely slow, judgment is impaired, and they may experience microsleep (seconds of unconsciousness).
Consequence: It's one of the most common causes of serious accidents on highways. The vehicle may drift out of its lane and collide head-on with another vehicle or leave the road at high speed without the driver taking any corrective action.
Seat Belt Not Fastened
Risk Detected: The driver is unprotected for an imminent impact.
Consequence: In case of collision or hard braking, the driver can be thrown against the steering wheel, windshield, or out of the vehicle. The risk of death or serious injuries (traumatic brain injuries, fractures) multiplies exponentially. It's also a serious legal violation.
Smoking While Driving
Risk Detected: Manual and visual distraction. The driver removes one or both hands from the wheel to handle the cigarette and may look away to avoid burns or look for the ashtray.
Consequence: Increases reaction time. A cigarette falling to the floor can cause a panic reaction and a sudden maneuver, leading to an accident. There's also a risk of fire inside the cabin.
Phone Use While Driving
Risk Detected: Complete cognitive, visual, and manual distraction (Triple Threat). One of the most dangerous distractions.
Mental: Attention is on the conversation, not the road.
Visual: Eyes are on the screen, not on traffic.
Manual: One or both hands are off the wheel.
Consequence: Driving while using a phone is comparable to driving under the influence. It causes inattention blindness (not processing what is seen) and drastically increases the probability of missing a sign, a pedestrian, or not braking in time.
Not Looking Forward for Extended Time
Risk Detected: Inattention blindness. Although the driver's eyes are "open," they are not seeing the road and the hazards unfolding ahead.
Consequence: At 100 km/h, a vehicle travels nearly 30 meters per second. In just 3 seconds of distraction, 90 meters are traveled "blindly." Any unexpected event in that stretch (traffic braking, an animal crossing) will result in an unavoidable collision.
Eating and Drinking While Driving
Risk Detected: Manual and visual distraction. Similar to smoking, the driver operates the vehicle with one hand and diverts attention to avoid spilling liquids or food.
Consequence: A spill of hot liquid or a maneuver to grab a falling object can cause a sudden and abrupt reaction, leading to loss of vehicle control or a distraction-related collision.
ADAS Events
Forward Collision Warning
Risk Detected: Imminent rear-end collision with the vehicle ahead due to excessive speed, distraction, or insufficient reaction time.
Why it's Dangerous: It's one of the most common and serious types of accidents. The ADAS camera calculates the distance and relative speed with the preceding vehicle. If the car approaches too fast and the driver doesn't brake, the risk of a high-speed rear impact is very high, which can cause serious injuries and significant material damage.
Headway Warning
Risk Detected: Driving too close to the vehicle ahead (tailgating).
Why it's Dangerous: Reducing the safety distance eliminates the necessary reaction margin to brake safely if the preceding vehicle stops or brakes suddenly. Any unforeseen event (a sudden stop, an obstacle) will result in an almost inevitable collision because the braking distance is physically insufficient.
Aggressive Lane Change
Risk Detected: A sudden and abrupt lane change, often without a clear view of the blind spot or at high speed.
Why it's Dangerous: The driver may invade the space of another vehicle in their blind spot, causing a side collision or a rear-end crash. The aggressive maneuver can also cause the vehicle itself to lose stability and control, skidding or rolling over, especially at high speeds or in curves.
No Turn Signal When Turning Left
Risk Detected: Lack of communication with other road users (drivers, cyclists, pedestrians).
Why it's Dangerous: When turning left (especially at intersections or when crossing lanes), the vehicle is exposed to a cross conflict with oncoming traffic. Not signaling the maneuver doesn't give others time to anticipate the action, potentially causing:
Side-frontal collisions with oncoming cars.
Pedestrian collisions of people crossing the street.
Impacts with cyclists or motorcyclists trying to pass.
No Turn Signal When Turning Right
Risk Detected: Similar to the previous one, it's a critical lack of communication with the environment.
Why it's Dangerous: Although it may seem less risky, not signaling a right turn is equally dangerous. It can cause:
Rear-end collisions: The vehicle behind doesn't anticipate the speed reduction to turn.
Pedestrian collisions: Pedestrians starting to cross the street where the car is turning are not alerted.
Impacts with cyclists: Who may be traveling in the right lane and don't expect the car to turn and intercept their path.
Driving Risk Events Table
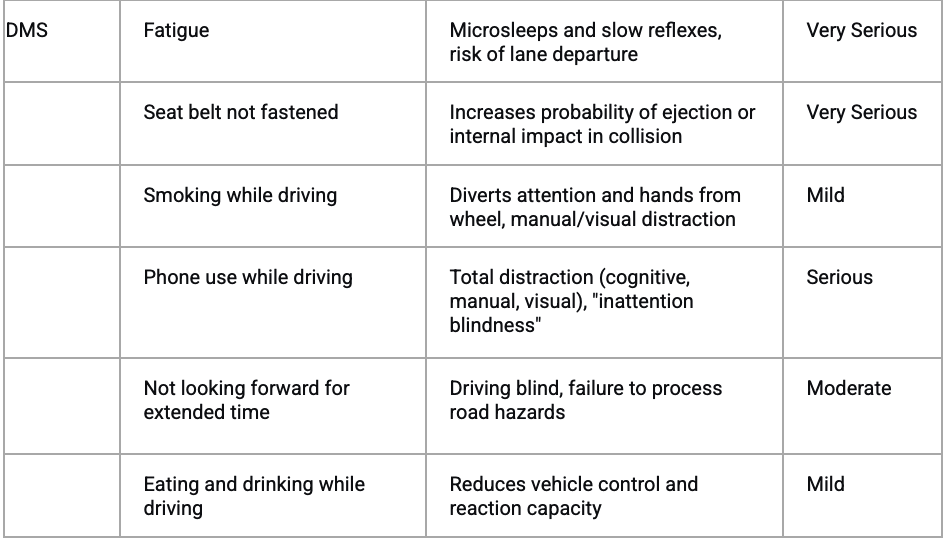
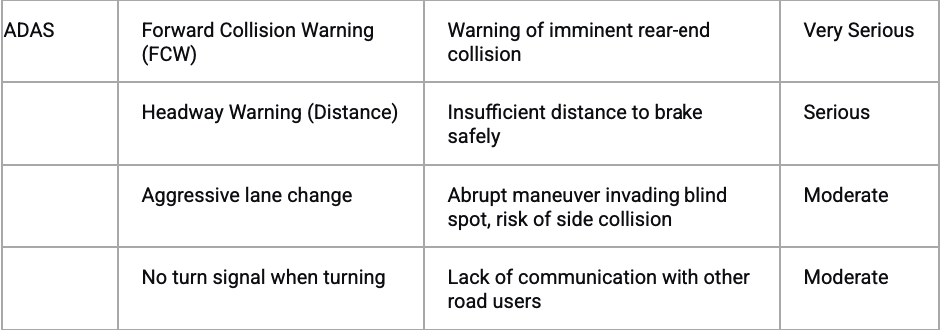

Note on severity levels:
Mild: Low risk, mainly associated with minor distractions
Moderate: Significant risk requiring correction
Serious: High risk of accident with possible injuries
Very Serious: Imminent risk of severe or fatal accident
Risk Multipliers by Accident Severity Table
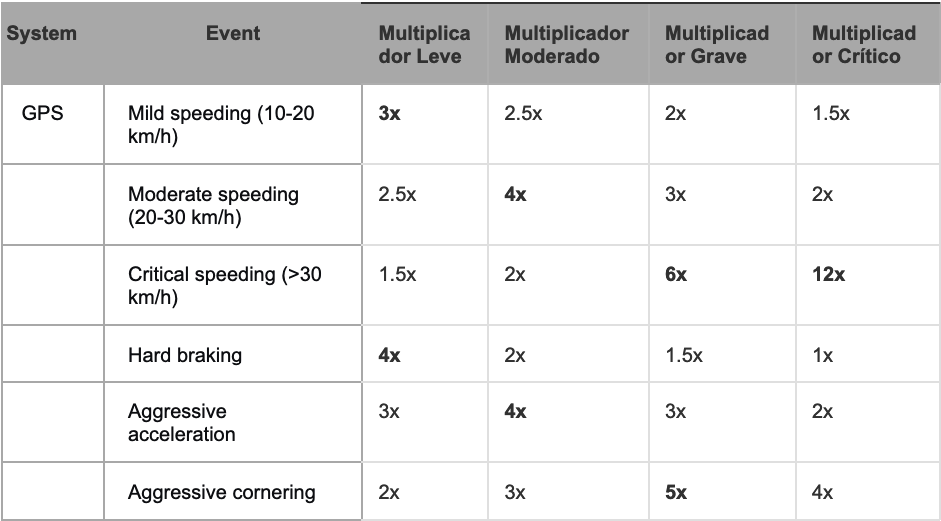
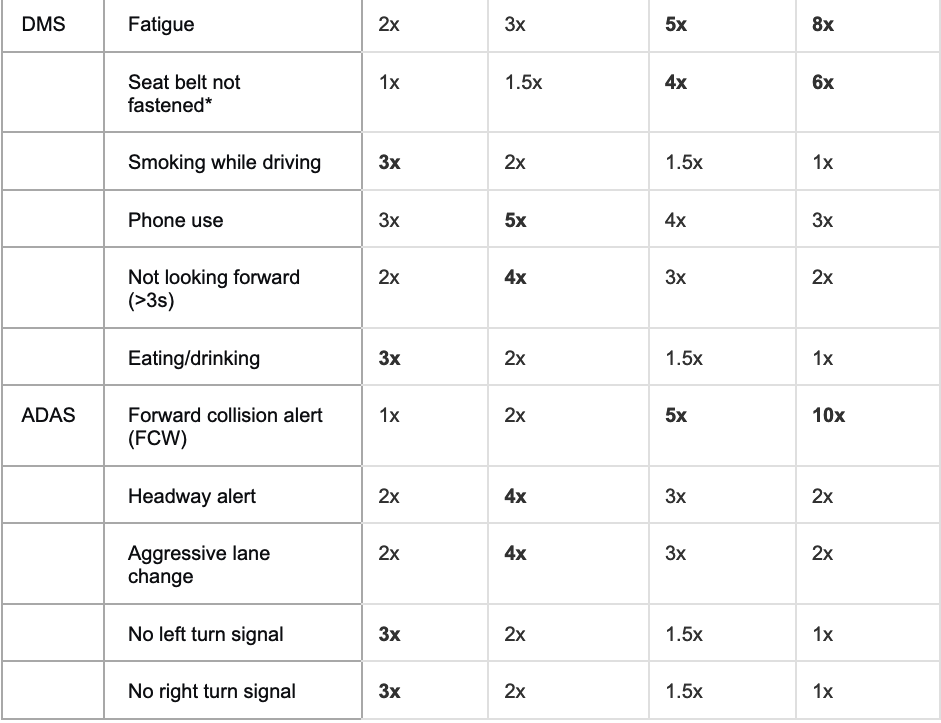
Note:
Bold: The most probable accident type for that event
Key Observations:
- The highest risk multipliers are for critical speeding (12x), forward collision warnings (10x), and accelerator at 100% (9x) for critical accidents
- Mild severity accidents are most influenced by hard braking, smoking, eating/drinking, and turn signal omissions
- The tables show a clear progression where certain behaviors predominantly affect specific accident severity types
- ECU events are included, expanding the risk assessment beyond GPS, DMS, and ADAS systems
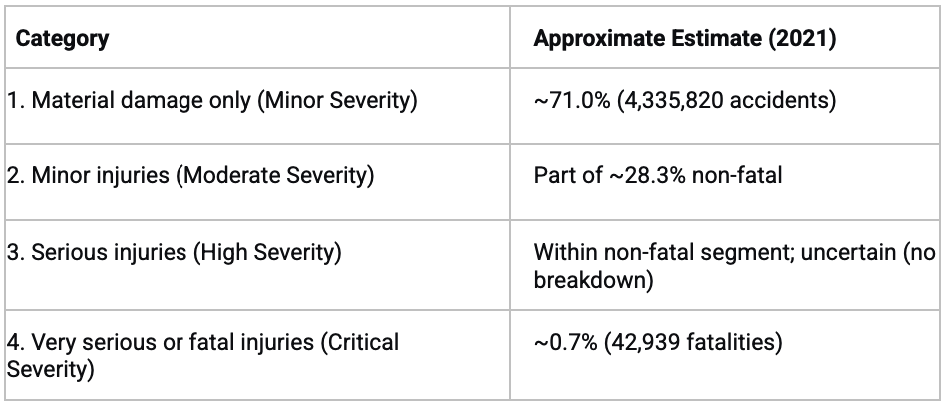
Percentage Estimation for Each Category
Based on available data, we can approximate the percentage distribution as follows:
Material Damage Only Accidents (Minor Severity)
Cases: 4,335,820
Proportion of total:
text
4,335,820 / 6,102,936 ≈ 71.0%
Accidents with Injuries (all injuries, without severity distinction)
Indirect calculation:
Total accidents minus material damage only =
text
6,102,936 − 4,335,820 = 1,767,116 accidents with injuries
Proportion:
text
1,767,116 / 6,102,936 ≈ 29.0%
Detailed Breakdown within Injury Accidents
Within this 29%, public data does not break down how many injuries were minor, serious, or very serious/fatal. However, it is known that there were 42,939 fatalities, representing only 0.7% of total accidents:
Fatalities:
42,939 / 6,102,936 ≈ 0.7%
Remaining (non-fatal injury accidents):
1,767,116 − 42,939 = 1,724,177 (approximately 28.3% of total)
Estimated Distribution According to Classification
Accident Type Probability Table (rounded and estimated)
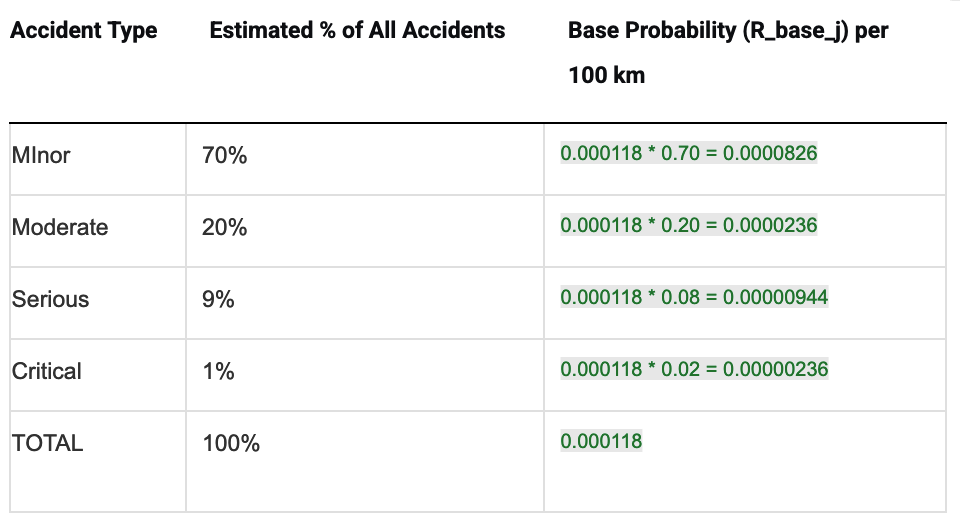
Note: The base probability of 0.000118 accidents per kilometer is derived from U.S. national statistics showing approximately 1.9 accidents per million miles traveled, converted to a per-kilometer basis for a standardized risk assessment model.
General Accident Risk Formula by Type and Distance
This formula has been adjusted to provide more aggressive or visible percentages for drivers and their instructors
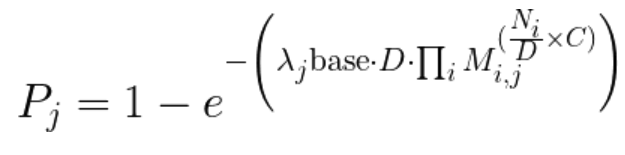
Where:
j: Accident type: Minor, Moderate, Serious, or Critical
P(Accident type j in D km): Probability of having at least one accident of type j (minor, moderate, serious, critical) when traveling a distance D In kilometers.
e: Euler's constant (approximately 2.71828). Base of the natural logarithm
λj base: Base accident rate of type j per kilometer. Represents the inherent risk of an average driver under average conditions
Example:
λminor base = 0.000000826 minor accidents/km
λcritical base = 0.0000000236 critical accidents/km
∏i: Product symbol. Indicates that all following terms should be multiplied for each detected risk event type i (e.g., speeding, hard braking)
Mi,j: Specific risk multiplier. Indicates how many times the base accident rate of type j increases per occurrence per kilometer of risk event i.
Example:
Mmild speeding, minor = 3 (Mild speeding triples the base rate of minor accidents per km)
Mhard braking, serious = 1.5 (Hard braking increases the base rate of serious accidents by 1.5x per km)
Ni: Total number of events of type i detected during the entire distance traveled D.
Example:
Nmild speeding = 5
D: Total distance traveled in kilometers
NiD: Event rate or density. Represents the frequency with which the driver commits that error (events per kilometer). This factor normalizes risk according to distance
C: Visibility constant - Scaling factor to make risks more visible and actionable for drivers and instructors
NOTE: In this model, 100% probability does NOT mean "you will definitely have an accident". It is a signal of extremely high risk, not a deterministic prediction.
The formula P = 1 - e^{-λ} calculates probability based on the expected number of accidents (λ).
Updated 9 months ago