Reports
The reports module gives you the ability to create and schedule reports for any of your vehicles. Most reports that are generated include 3 main files, a summary, a detail, and an analysis.
- The summary provides a quick overview of the information contained in the details.
- The details go more in-depth about the contents of the report and list the specific incidents or occurrences of each metric.
- The graph visually shows the information that’s found in the summary.
- Reports will have three buttons in the bottom-right corner:
- Load Parameters: When this button is clicked, a list of existing scheduled reports is displayed. You must select one of the scheduled reports, and this will load into the report you want to create the parameters that were selected in the chosen scheduled report—for example: columns, properties, time zone, filters, and checkboxes.
- Scheduled Reports: This button opens the scheduled reports dialog.
- Generate Report
Generated reports can be downloaded in 3 formats: CSV, XLSX, or PDF.
The navigation of this section has 3 main icons in the top left corner:
| Icon | Function |
|---|---|
 | Create New Reports |
 | View Generated Reports |
 | Schedule Recurring Reports |
General Considerations for ReportsPDF for reports are supported only for the summary, with the exception of the trips report, which also generates a PDF for each entity detail.
Georesolve
If a report has more than 10,000 details it will not be georesolved (converted into an address), only the coordinates of the event will be shown.
Excel Generation
If a report has more than 50,000 details the Excel format .XLSX will not generate, only a .CSV will generate with the details.
Excel Entity-per-Sheet
If you select the option Create one Excel sheet per entity, a total of up to 255 entities (vehicles and assets) are supported. Note that if the excel with this option has more than 50,000 details it will only generate a CSV.
Charts
Charts have a limit of up to 20,000 events, and 60,000 events for the Temperature Report.
Email Attachments
Reports that are greater than 25MB are sent as .ZIP attachments and a link is generated for the recipient to download
A resource called reports "engines" is used to separate reports intended for specific gateways and enhaced reports.
You can find a list of all the report engines in the Global Labels List , within the report engine there is a file called a "manifest" which contains the specific configuration that's used for the report, there you will find more information about the report, including what fields and parameters are supported as well as the labels used to generate it.
Live Reports
The live reports generate data in real-time, they wait for the vehicles to report data in order to show it.
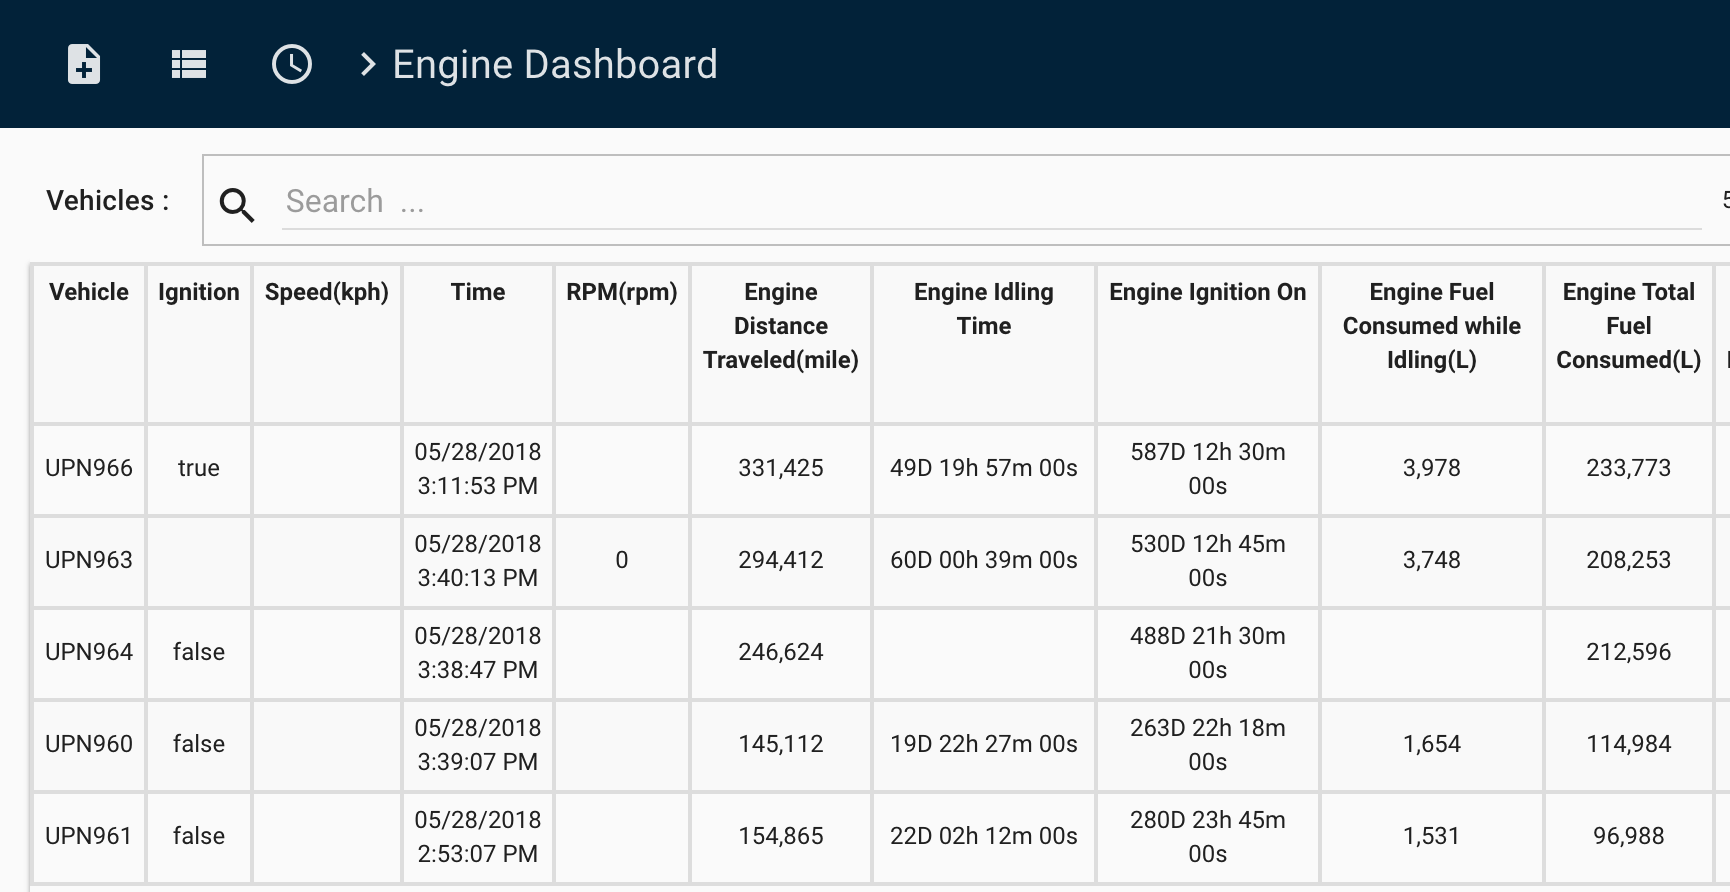
Engine Dashboard
The Engine Dashboard report gives you a quick overview of any engine parameter that is supported by the truck/vehicle. It supports multiple vehicles simultaneously sending data.
Note that the table is populated when the vehicle is ONLINE and sends a report.
Temperature
The temperature report shows you the live temperature of one or many entities. This report is compatible with the following entities that report temperature:
- Titan
- Bluetooth Tag – can also report the relative humidity as a %
- Temperature Sensor Accessory – can report the state of inputs
Sections in this report include:
- LIVE – a live dashboard-like view, that compares different entities capable of reporting temperature.
- CHART – a look at the temperature variations over time.
- HISTORICAL – temperature values over time in a table format, can be downloaded.
- SUMMARY – summary of the average temperatures daily per entity.
Accessories Reports
Fuel Level ECU
Get a historical look at how the ECU Monitor reported the fuel level from either the analog level (from the gray and blue cables) or the percentage value read from the onboard computer.
If the fuel is measured using the percentage there’s an extra column in the Details that shows an approximate fuel consumed per trip.

NoteThe Fuel Tank size is a parameter that can be saved on the vehicle’s information in the Organization module.
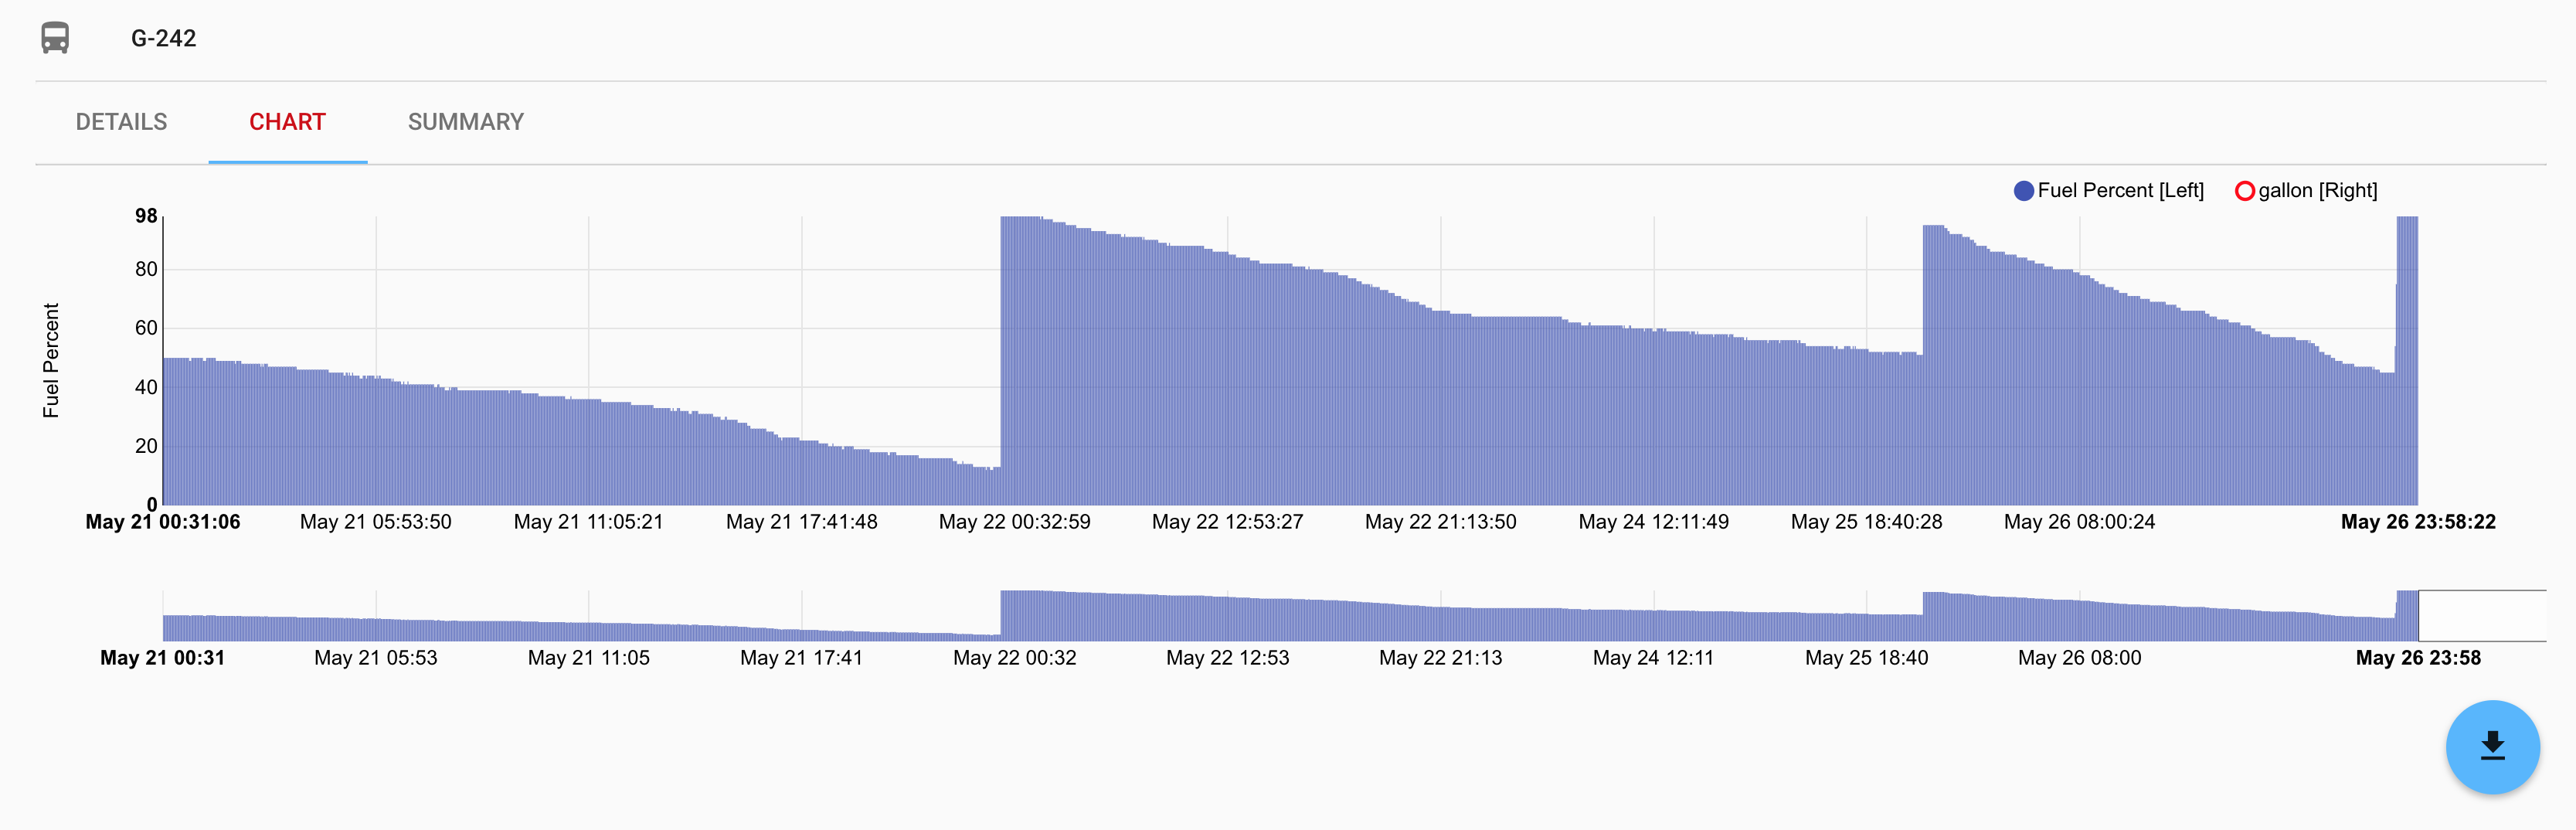
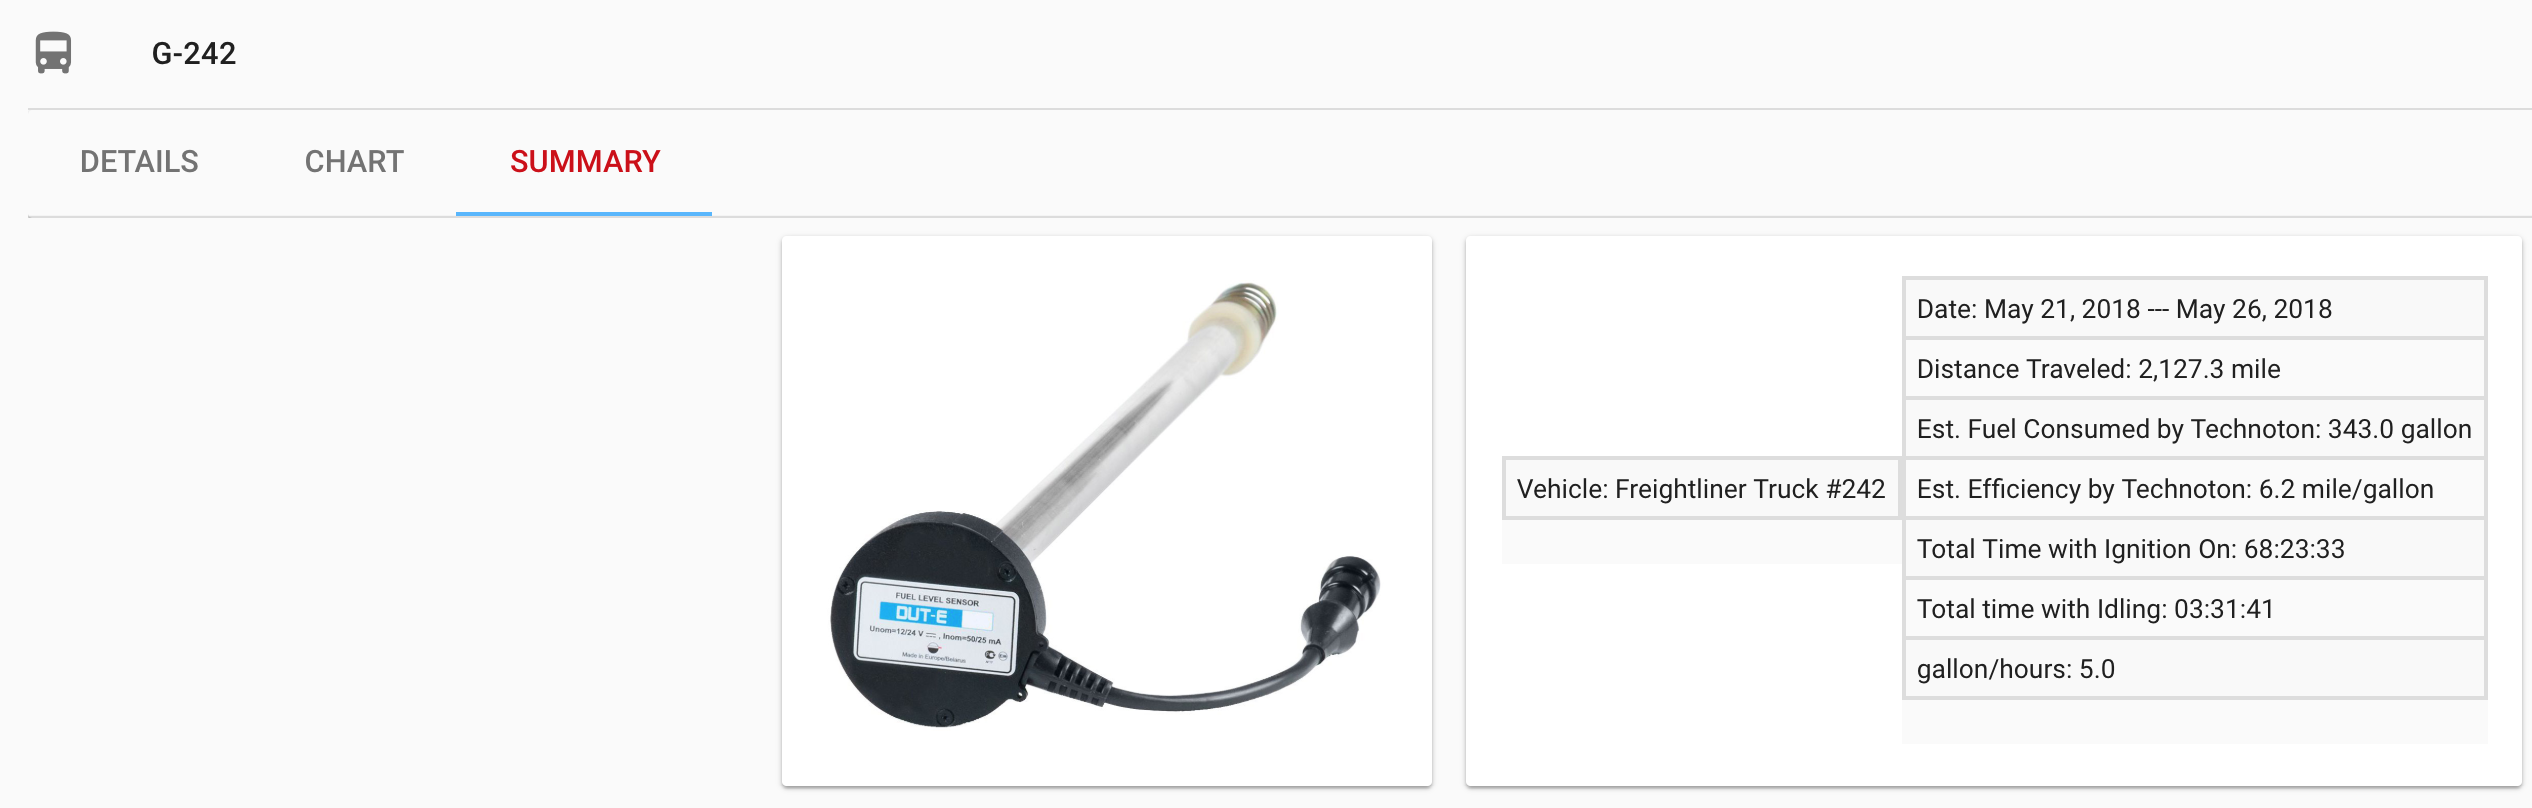
Fuel Level Technoton
Get a historical look at how the Technoton Fuel Level Rod sensor reported the fuel level.
In the details of this report, you’ll also get an estimated fuel consumed and efficiency per trip.

Mobileye
Mobileye is a camera that can alert you if you are swaying too close to the side of the lines marked on the road, and even let you know when you are too close to the vehicle in front of you.
With this report, you get a look at how many departure warnings or Headway warnings your vehicle generated over any period of time.
Schedule this report to get an idea if your drivers are improving on a weekly/monthly basis.
Satcom
The Satcom report shows you the places where your device reports when there’s no network/cellular coverage, it requires a special accessory that’ allows communication with satellites for communication instead of cell phone towers.
Trip Analysis Reports
Trip Analysis Reports analyze the behavior of vehicle’s and capture important metrics that are derived from two main factors, a vehicle’s distance and ignition time.
Depending on the report you’ll have a summary of these two factors under different scenarios.
Some things to keep in mind when looking at the reports:
- Distance calculations are done in 3 main ways
- Device priority – this means that the devices are the ones calculating the distances internally, and an accumulated value is reported whenever the device reports an event
- Gateway priority – this means that Pegasus is calculating the distance traveled based on the GPS coordinates of each event
- ECU priority – this value is read from the vehicle’s onboard computer engine and represents what’s on the vehicle’s overhead dashboard. This requires a physical connection to the vehicle’s engine either via an accessory like with the ECU monitor, or a Syrus 4 device.
Note
The first two criteria depend on the device’s visibility with GPS satellites, if view is obstructed for a long period of time the distance calculations will lose accuracy.
- Ignition calculations are done in 2 main ways:
- Device priority – physical wire connected to the vehicle’s ignition
- ECU priority – the engine hours are read from the vehicle’s onboard computer
Note
If the wire is connected to the wrong location in the vehicle’s ignition detection or if the wire breaks at some point it will lead to inconsistencies in the ignition duration and any derived calculations.
Some considerations when calculating metrics with devices:For both the distance and ignition metrics the device priority means that we’ll use what the device reports in the order it sends it as the source of truth. In our experience with some third party manufactured devices we have seen some behaviors where the data may not always come in chronological order, or there’s gaps in information, or unexpected jumps in the data. Most of these cases are handled internally by the system, however the chronology of the data is vital for the calculation of information.
If you notice inconsistencies in the data it may be caused from a device that was recently installed or swapped out, this should only last one day and then fix itself afterwards, however if it persists you may need to revise the installation or device to ensure proper functionality.
24 Hour Detailed Report
See a detailed location report of where your vehicle has been in the last 24 hours. Schedule this report to generate daily and be sent to your email.
- Quick and easy to use
- Schedule to arrive daily to have a snapshot of your vehicle’s past 24hrs of activity

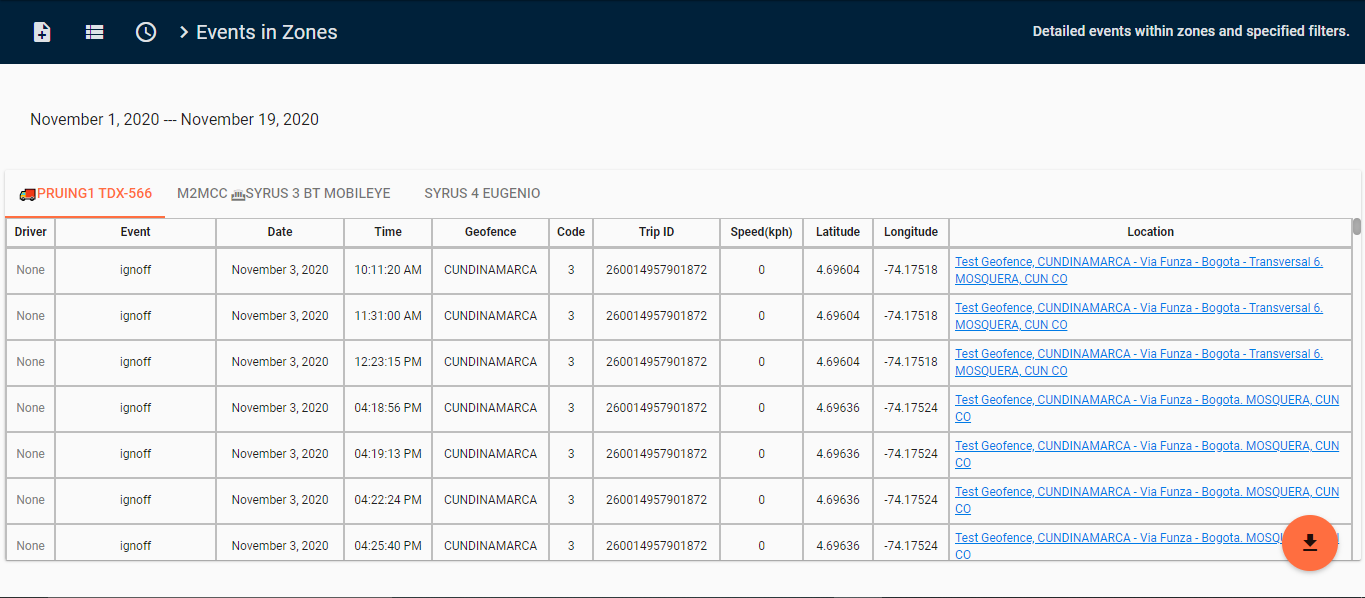
Events in Zones
See the special events that are generated in a particular geofence or zone. This is useful for knowing where your inputs or outputs are activated inside a region. Or in which zone your speeding events occur more often
This report requires that you have a geofence already defined in the system. It asks you to filter by the name of the event that was generated. Events are any action that the vehicle reports, such as excessive idling, speeding, ignition turned ON/OFF, etc.
- View events generated by vehicles within geofences.
- Filter events by code or label you want to include in the report, as well as hours by a time range.
- Include geofences or collections that you are interested in viewing the events.
NoteA geofence is required to generate this report.
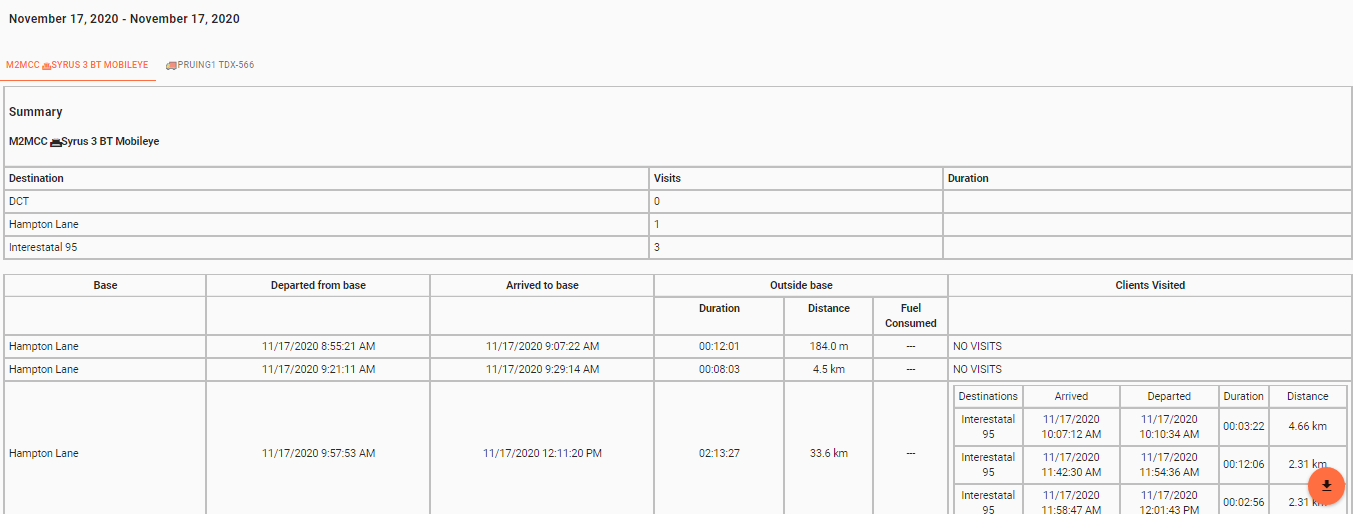
Trip Analysis Between Geofences
This feature helps you track whether your drivers are reaching their scheduled drop-off points and how long they stay there.
To use this feature, you need to set up a main location (base) and several destination areas (fences). You can also group these destination areas into collections.
For example, imagine you manage a fleet of delivery vehicles. You might set the main location as the “Central Warehouse” and create a collection named “Floral Shops”, which includes several individual shops or geofences. With this setup, you can see when a vehicle leaves the Central Warehouse, whether it visits any of the floral shops, and how much time it spends at each shop.
- Travel and stop information to and from any selected geofence.
- Shows geofence exits and visits to different fences until reaching the base geofence again.
- Fuel consumed per trip between geofences: the amount of fuel consumed per trip is based on the accessory connected to the unit (ECU Monitor / Technoton Fuel Rod).
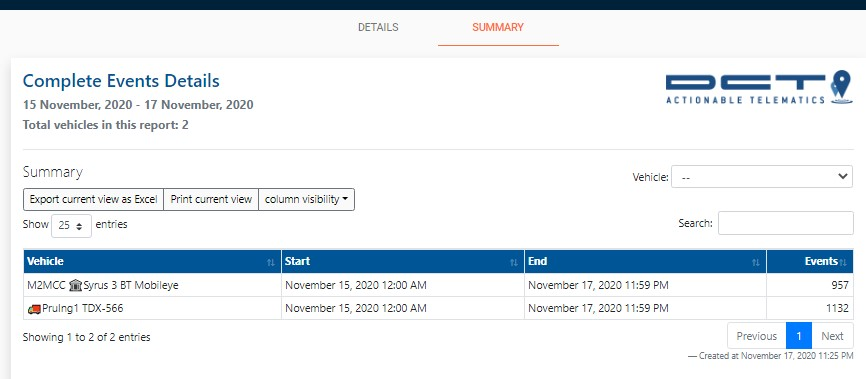
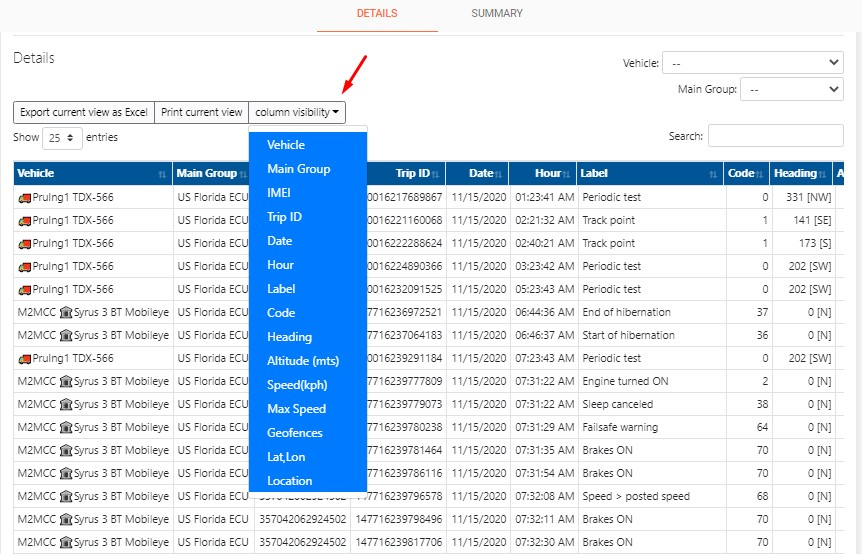
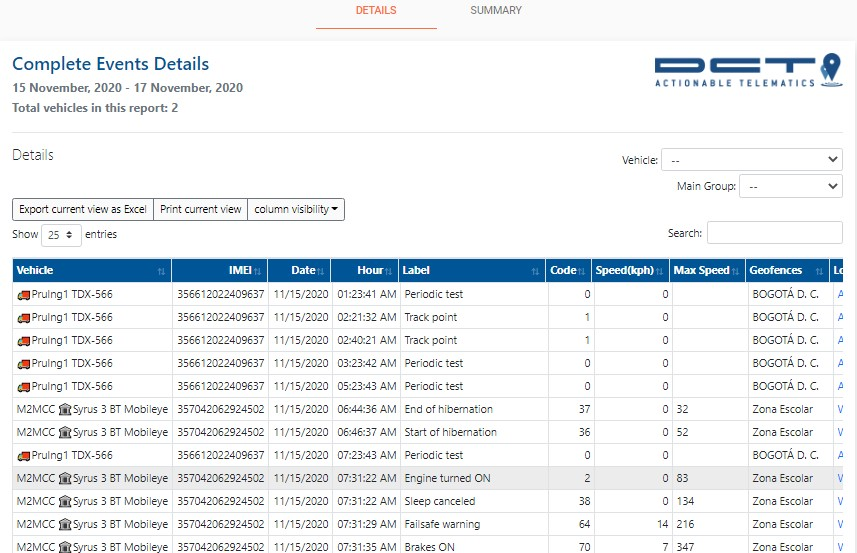
Complete Event Details Report
The complete event details report features an indepth look at all the events reported by the devices from any time period.
- Detailed report for all events for the selected vehicles.
- The report can filter columns, which allows us to focus on the information we require.
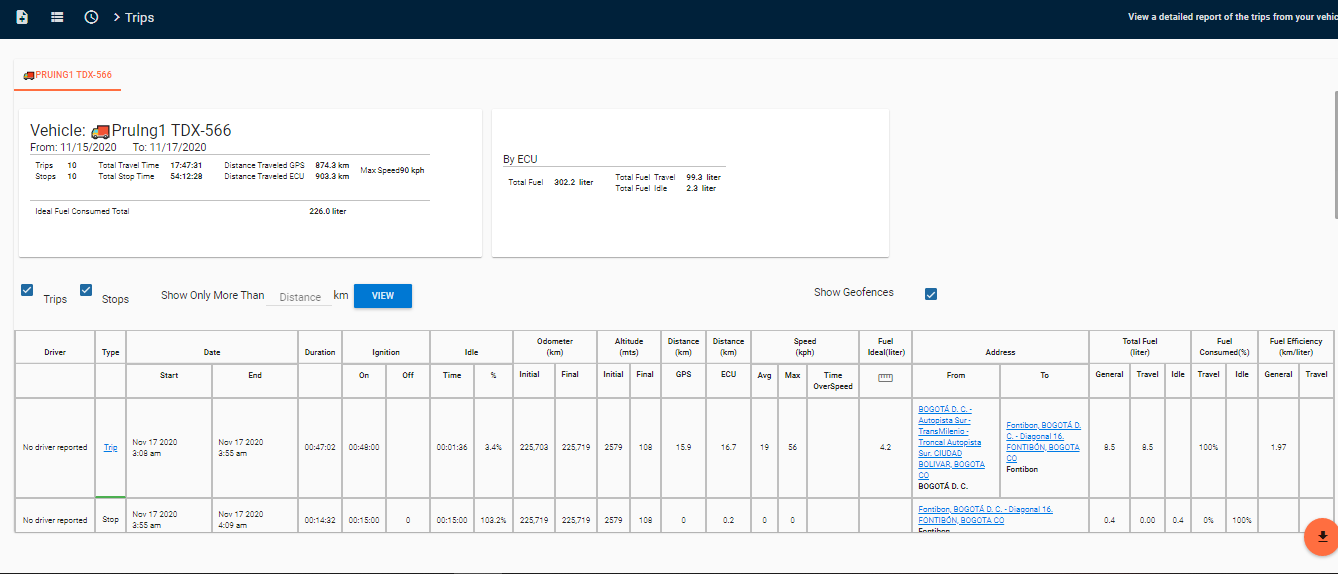
Trips Report
The Trips Report offers a comprehensive overview of the routes taken by your vehicle, detailing both the starting and ending locations. Depending on your trip configurations, you may also observe instances where the vehicle is idle at certain stops.
Report Features
-
Trip Duration: Review the duration of each trip made by your fleet vehicles.
-
Engine On/Off Time: Track the total time the engine was active or inactive during each trip.
-
Idling Time: Monitor the total duration the vehicle spent idling, defined as having the ignition ON without movement. Idling time is counted after 3 minutes of detecting this condition.
-
Speeding Time: Identify the total time the vehicle exceeded the defined speed threshold. Speeding time begins immediately upon surpassing the speed limit configured in the device parameters.
-
Estimated Fuel Consumption: Estimate the amount of fuel consumed based on the efficiency parameter specified in the vehicle's description.
-
Real Fuel Consumption: Access the actual fuel consumption per trip, calculated using data from the Engine Control Unit accessory directly connected to the vehicle's onboard computer.
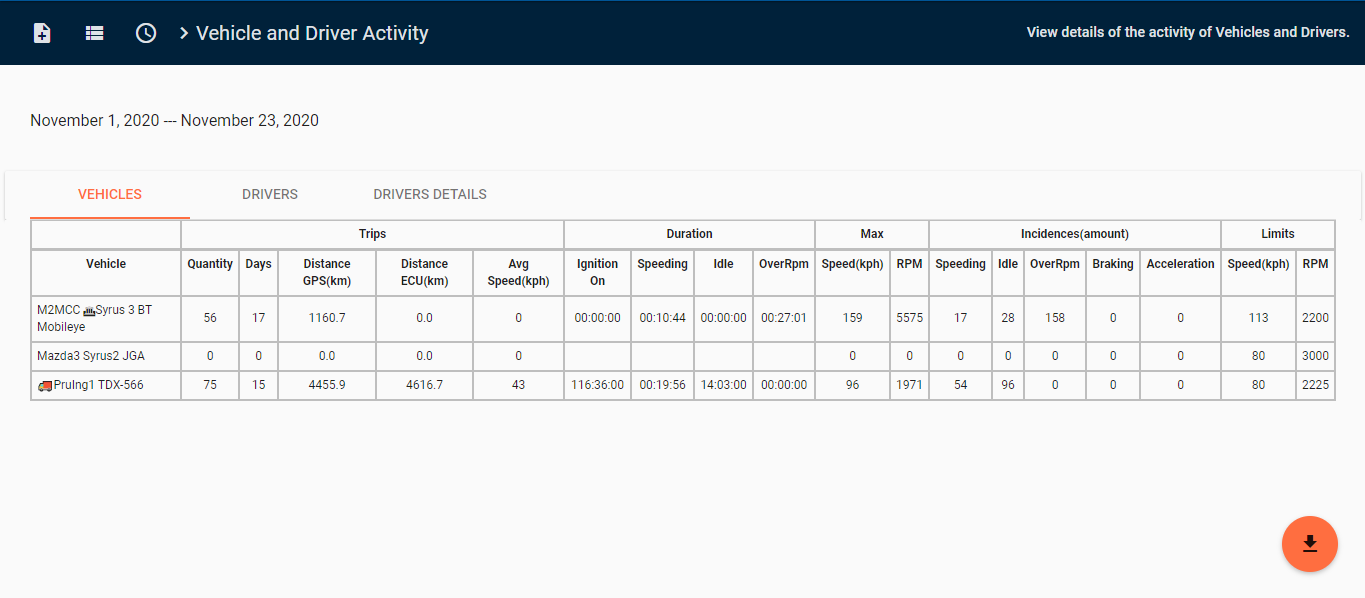
Vehicle and Driver Activity
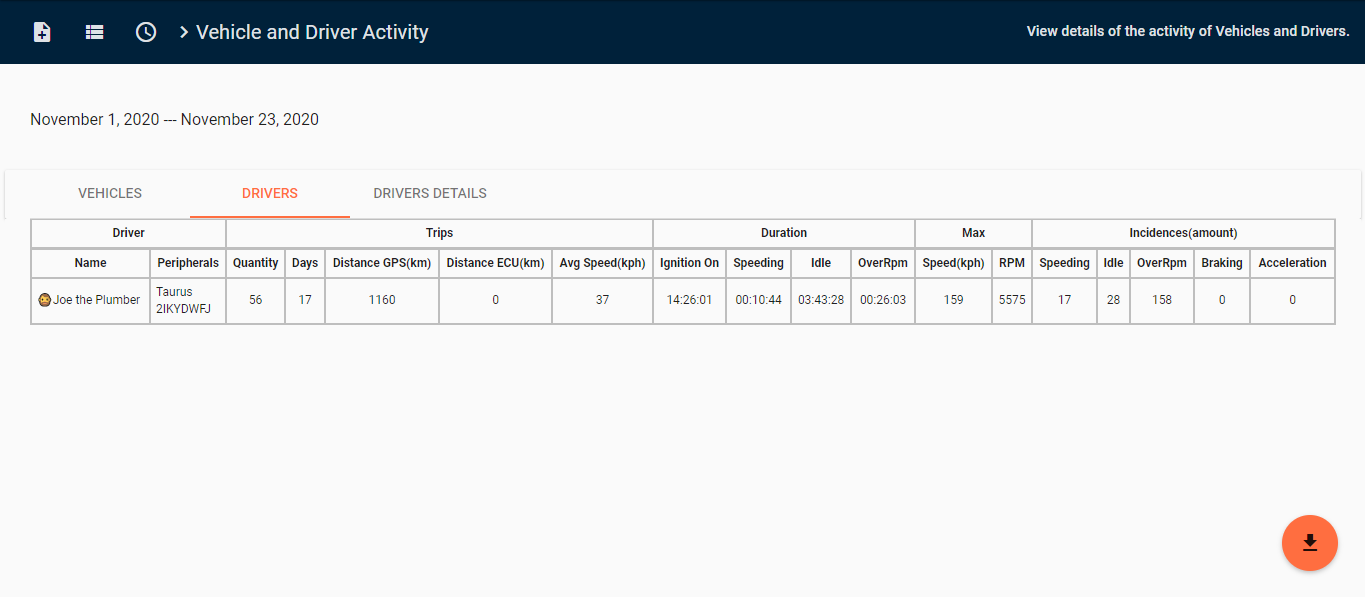
This report gives you a breakdown of the activity performed by both your vehicles and drivers. It provides you with a summary of the trips each driver performed, and how their metrics compare, including Durations, Max values, & Incidences.
Incidences are calculated as the number of times:
- Speeding: the vehicle spends 10 seconds continuously over the speed limit. (Note that there’s only a single speed limit threshold established for this incidence amount)
- Idling: the vehicle spends more than 10 minutes with the engine ON and the vehicle has not moved.
- OverRPM: the vehicle spends more than 10 seconds continuously over the RPM threshold (note that this requires the ECU accessory)
- Braking: the vehicle brakes aggressively (~-0.6g)
- Acceleration: the vehicle accelerates aggressively (~+0.6g)
There are many ways to identify yourself as a driver, such as:
- iButton
- RFID
- Taurus App
- Bluetooth tag
Contact an administrator to figure out the best and most effective way for your drivers.
Report Features:
- View a summary of vehicle and driver trips, duration of counters, the limit and max speed, and the amount of incidents
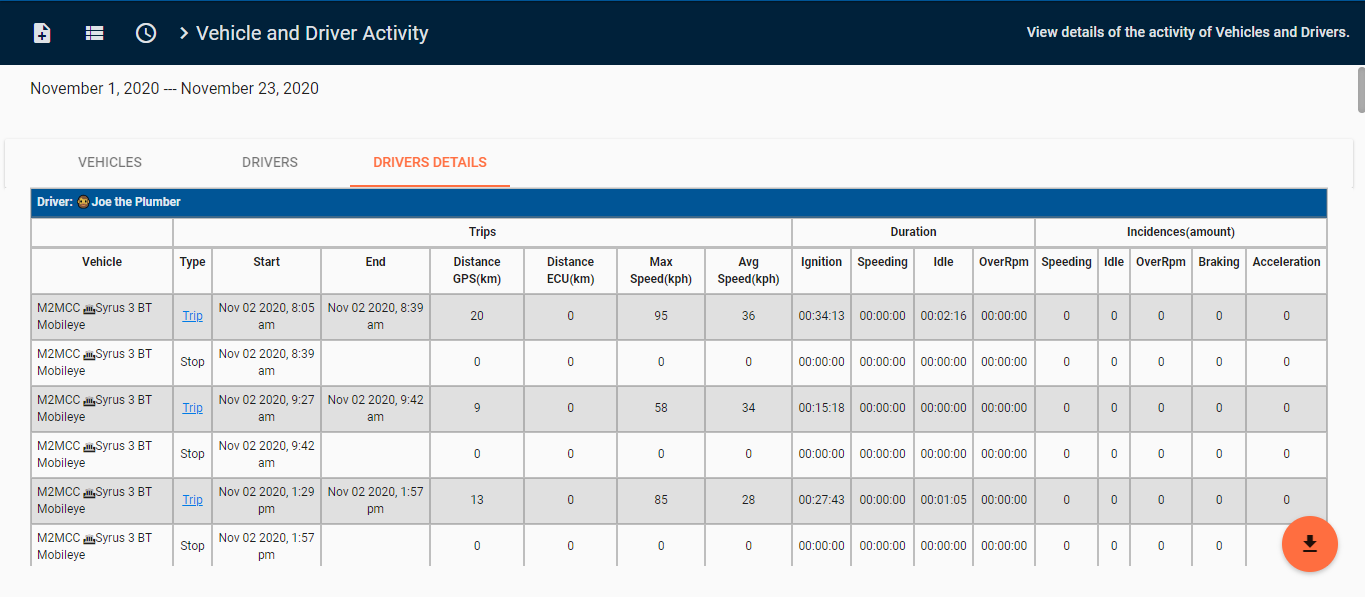
- Includes a detailed view of the driver’s trips
NoteThe RPMs column requires the ECU monitor accessory or a Syrus 4G.
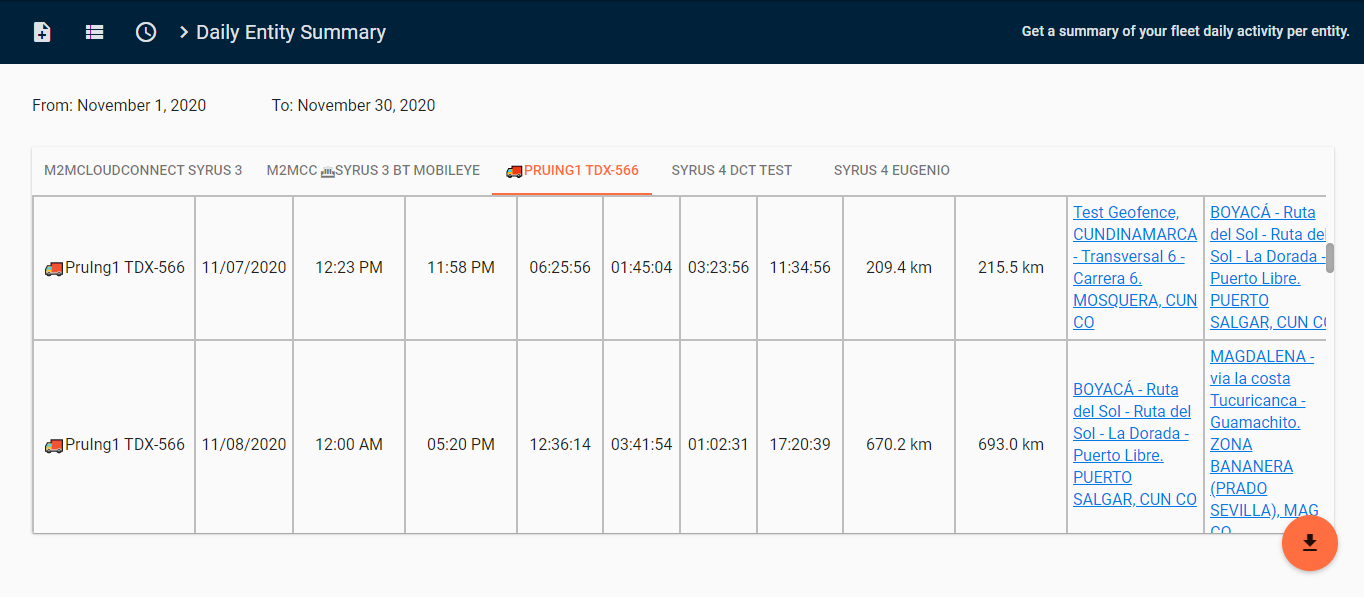
Daily Entity Summary Report
The daily entity summary report features an overview of the durations that each vehicle spent with the ignition ON and distances driven.
Report Features:
- View driving, idling, stopping and total time
- View the summary of your fleet's daily activity per entity
- View when and where the vehicle starts/ends the activity of the day
- Includes distances traveled by the device and ECU (if available)
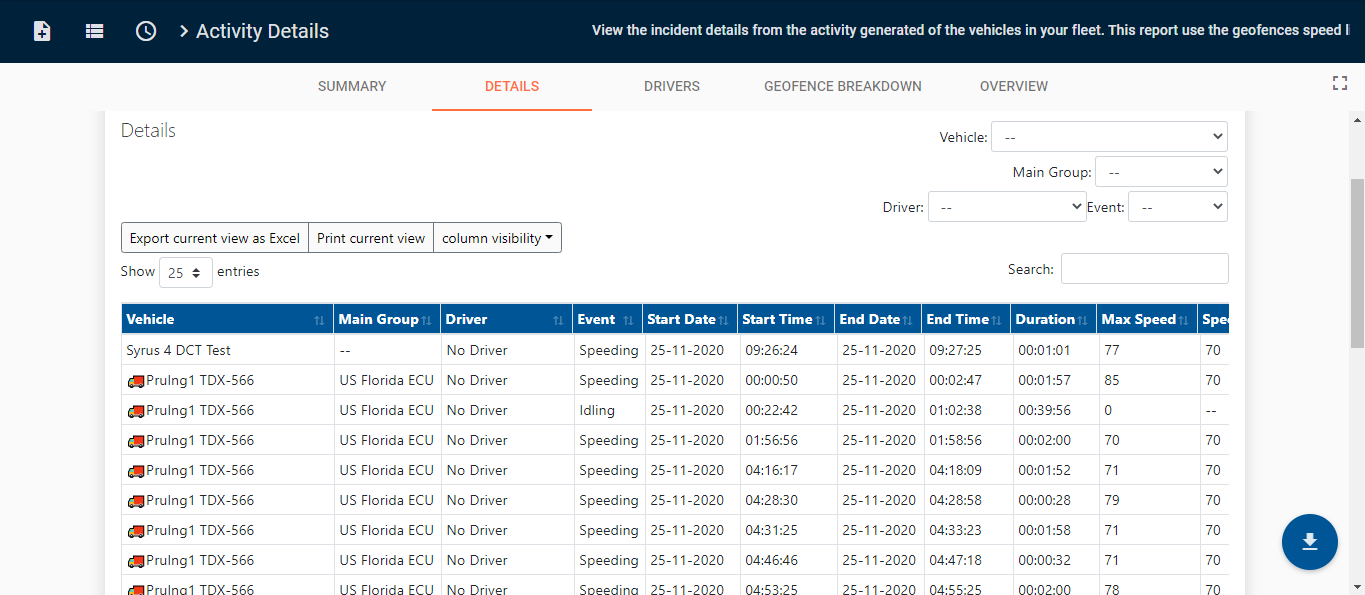
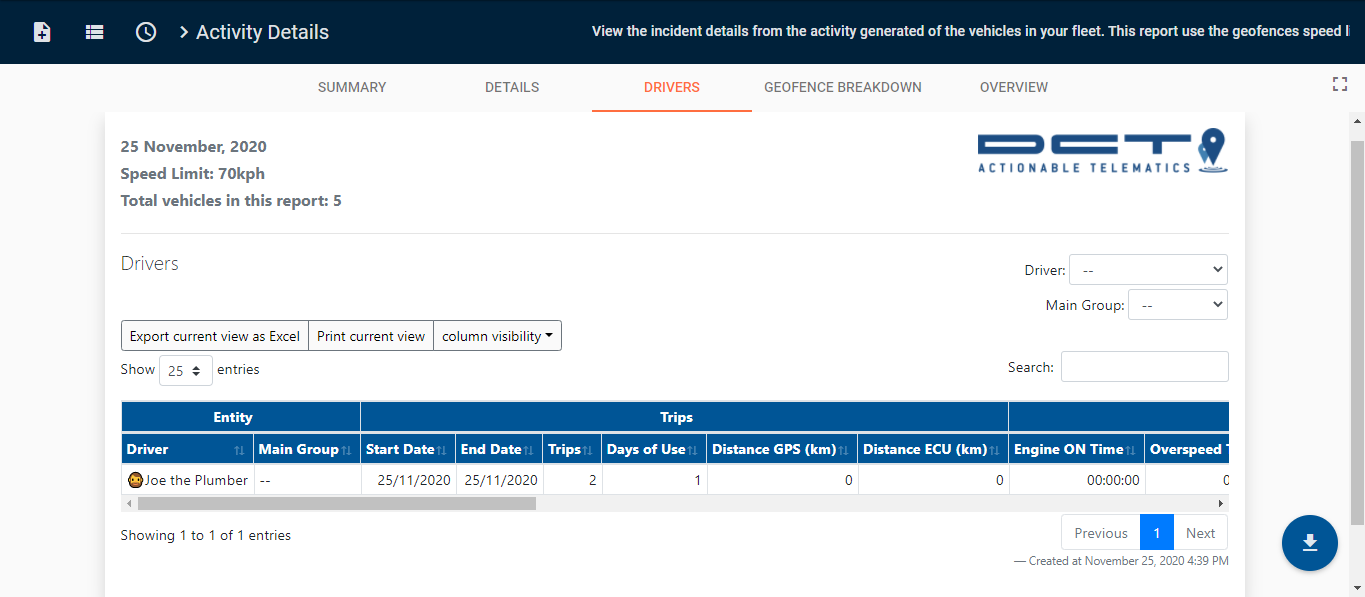
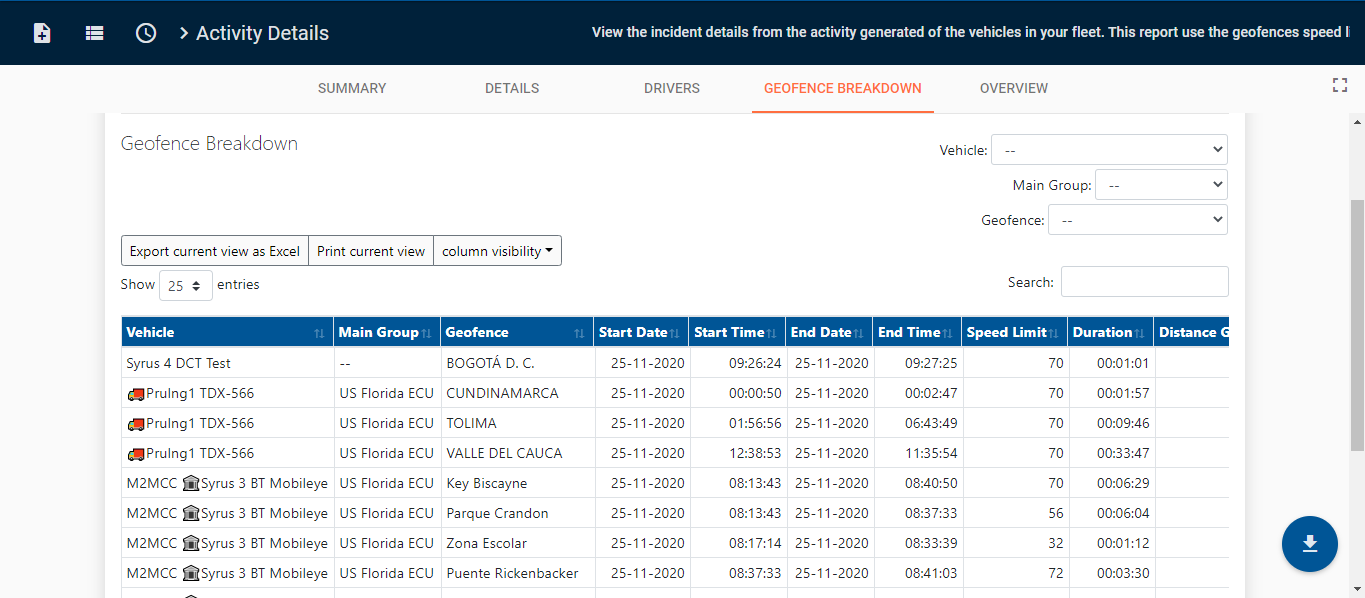
Activity Details Report
Engine: default, Script: activity_details
The Activity Details report offers a comprehensive overview of all activities conducted by your vehicles and drivers. It furnishes a detailed summary of durations, maximum values, and incidents that transpired at any given time. Moreover, this report seamlessly integrates with the speed limit property for geofences, enabling you to identify vehicles that exceeded specified speed limits within designated geofenced areas.
Incidents in the report are calculated based on specific criteria:
For a list of the incidents or labels used for this report, refer to the manifest found in the Global Labels list
-
Speeding (Normal): The vehicle is considered to be speeding if it exceeds the predefined speed limit for a continuous duration of X seconds. This duration can be adjusted in the device configuration.
-
Speeding (Geofence): Occurs when the vehicle surpasses the speed limit set within the properties of a geofence.
-
Aggressive Driving: This event is triggered when the vehicle exceeds a predetermined threshold of force, as configured in the device settings.
-
Idling: Detected when the vehicle's engine remains on for more than 10 minutes without any movement.
-
Hard Braking: Recorded when the vehicle undergoes aggressive braking, typically at a deceleration rate of approximately -0.6g.
-
Harsh Acceleration: Occurs when the vehicle accelerates aggressively, typically at an acceleration rate of approximately +0.6g.
-
OverRPM: Detected when the vehicle's engine operates continuously above the RPM threshold for more than 10 seconds.
-
Coast: Recorded when the vehicle maintains high speeds with low RPMs.
-
Engine Braking: Detected when the vehicle utilizes engine braking techniques.
NoteThe following incidents require the Syrus 4G or an ECU monitor Accessory: OverRPM, Coast, and Engine Braking.
There are many ways to identify yourself as a driver, such as:
- iButton
- RFID
- Taurus App
- Bluetooth tag
Contact an administrator to figure out the best and most effective way for your drivers.

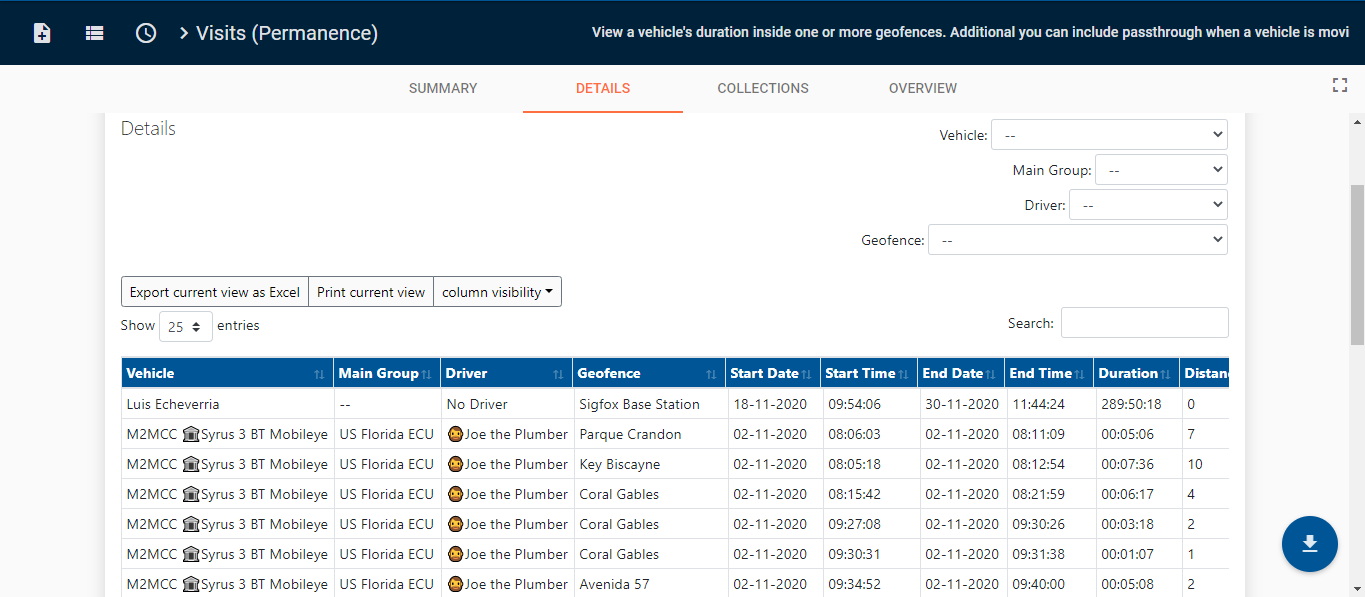
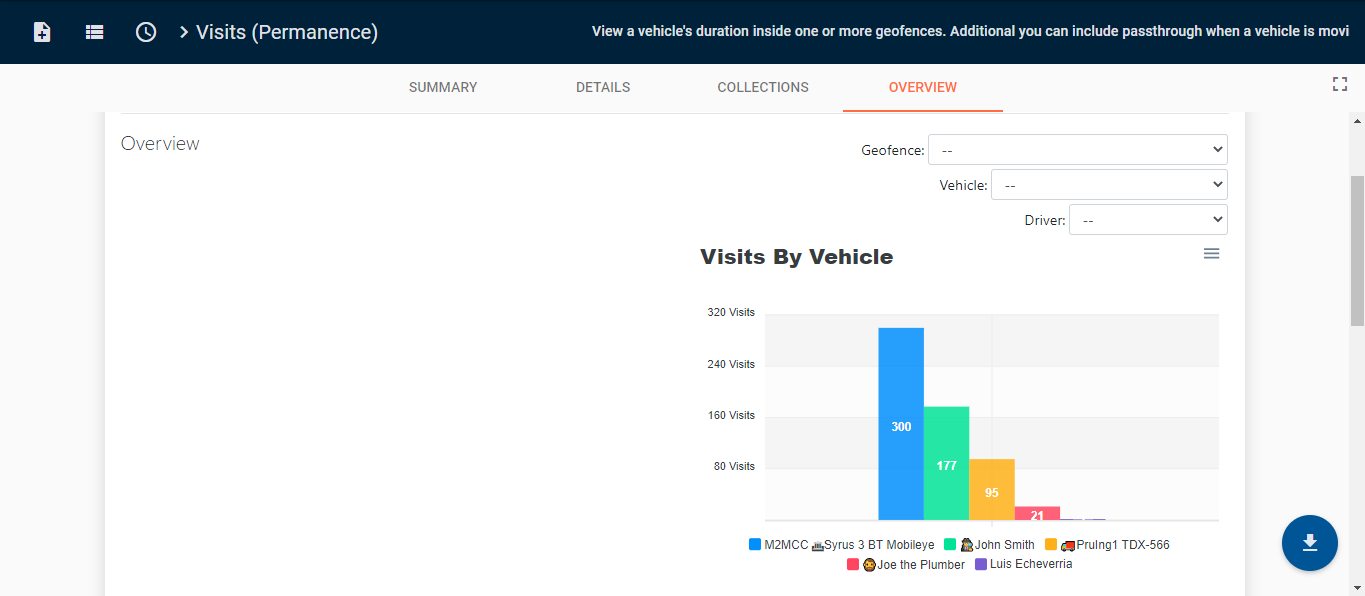
Visits (Permanence) Report
The visits report tells you where you’ve been and for how long. It looks at the locations or geofences you’ve defined in order to make a report of the places you’ve visited.
Report Features:
- Duration Tracking: Monitor the duration of a vehicle's presence inside one or multiple geofences, providing insights into its time spent within specific areas.
- Visit Frequency: Track the number of visits made by a vehicle to individual geofences, allowing for the analysis of visit patterns and frequency.
- Passthrough Detection: Identify instances when a vehicle passes through a geofence while in motion for at least one minute, enabling comprehensive monitoring of fleet movements.
- Detailed Visit Analysis: Access detailed information regarding each visit, including entry and exit times, duration of stay, and any noteworthy events that occurred while inside the geofence.
- Collection Summary: Obtain a summarized overview of vehicle activities within a collection of geofences, facilitating the analysis of fleet behavior across multiple geographic areas.
NoteA geofence is required to run the Visits Report.


Fuel Consumption Report
Shows a per-vehicle summary of the fuel sensor along with the amount consumed, fill-ups, efficiency, and other metrics.
Report Features:
- Summary View: Easily access a summary of the fuel consumed per vehicle, distance traveled in miles, the number of fuel fillings, and the average efficiency.
- Detailed Fuel Consumption: Gain insights with a detailed view of each vehicle's fuel consumption, allowing for a comprehensive analysis.
- Detection of Fuel Loss: Detect fuel loss and potential fuel theft, providing added security and monitoring capabilities.
NoteThe vehicle must have fuel-related sensors configure
Select the 'Disable Ignition Check' checkbox before generate the report if you do not want the system to consider the ignition status when recording fuel loss.


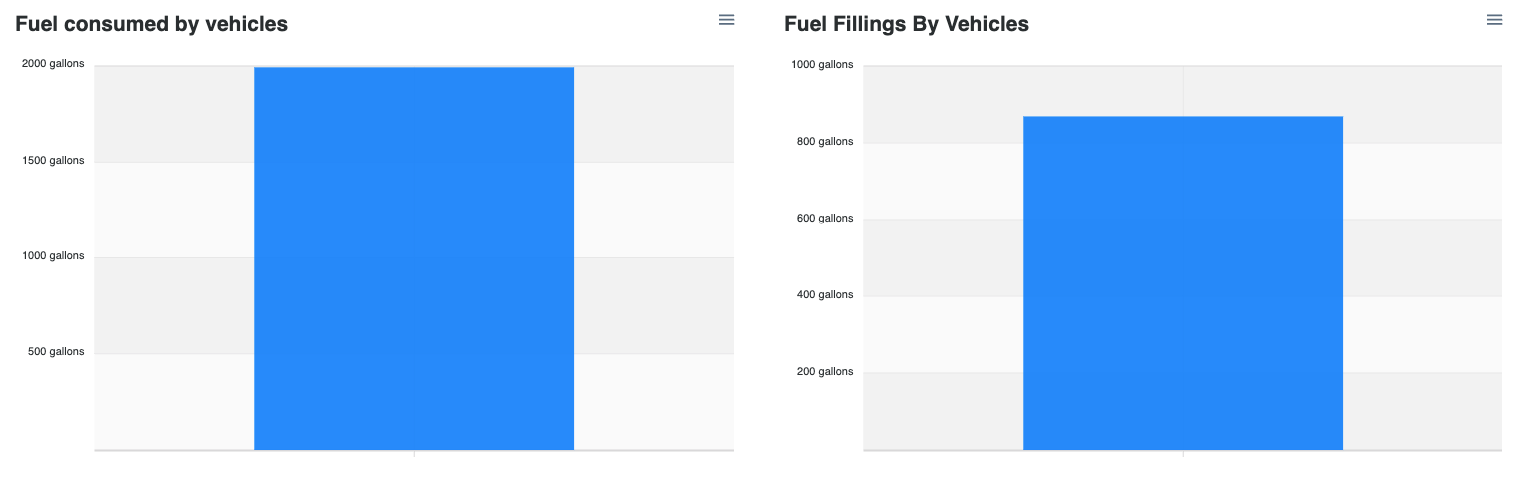
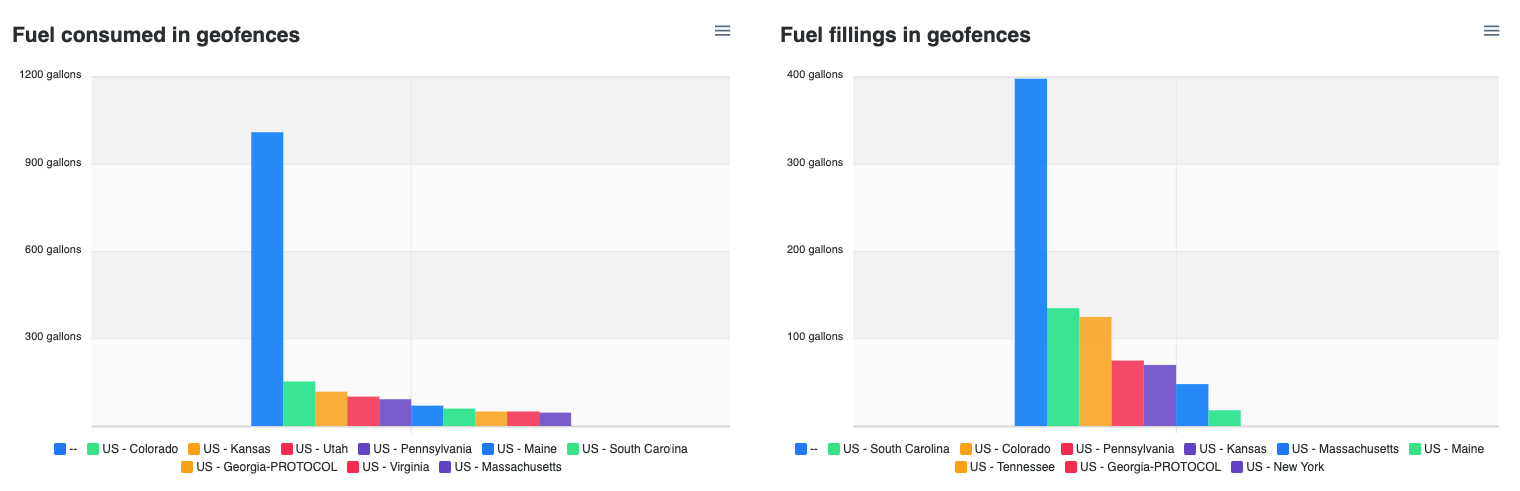
- Fuel Fillings: A fuel filling event is detected when there is a fuel increase of at least 15% relative to the tank capacity, validated against statistical noise filtering (z-score) and time-series consistency checks. This threshold is fixed and not user-configurable.
- Fuel Loss: Fuel loss occurs when the following conditions are met: 15% or greater decrease while the ignition is on, the distance traveled is less than 1 km, and the time range is less than or equal to 35 minutes. (Configurable)
- Fuel Theft: Possible fuel thefts occur when the following conditions are met: 15% or greater decrease when the ignition turns on again. (Configurable)
Additional – changes in the odometer with any fuel loss (independent of the ignition).
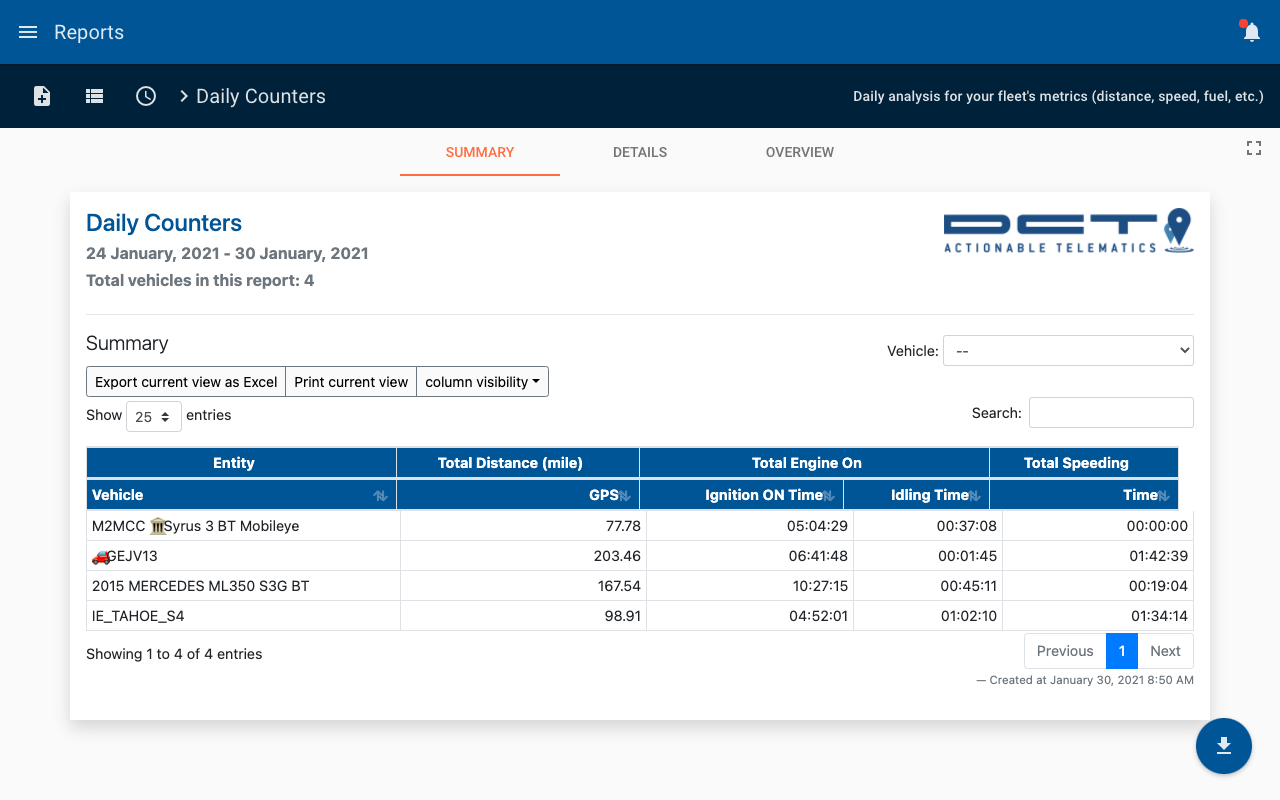
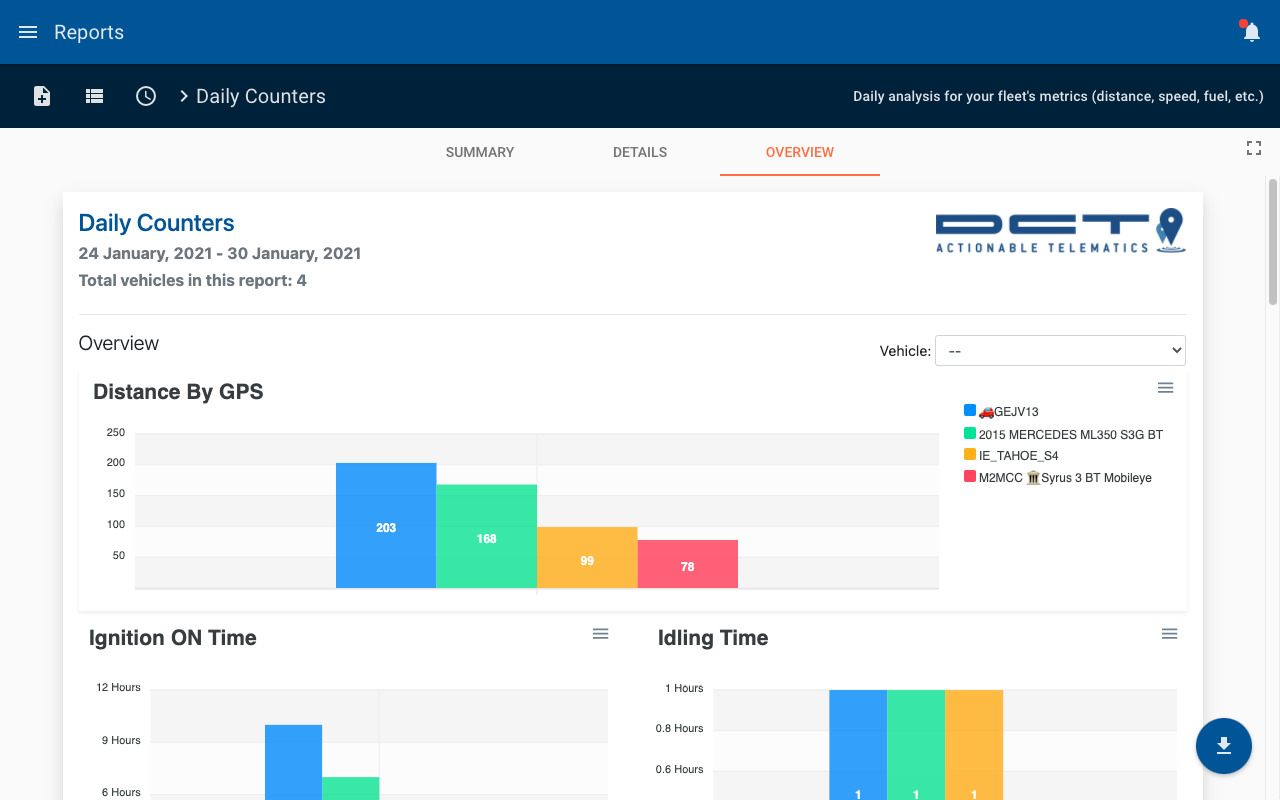
Daily Counters Report
Analyze the daily metrics for your entire fleet quickly, including the distance driven, time spent driving, idling, and speeding. If you have an ECU monitor you’ll be able to see how much fuel you consumed and wasted idling.

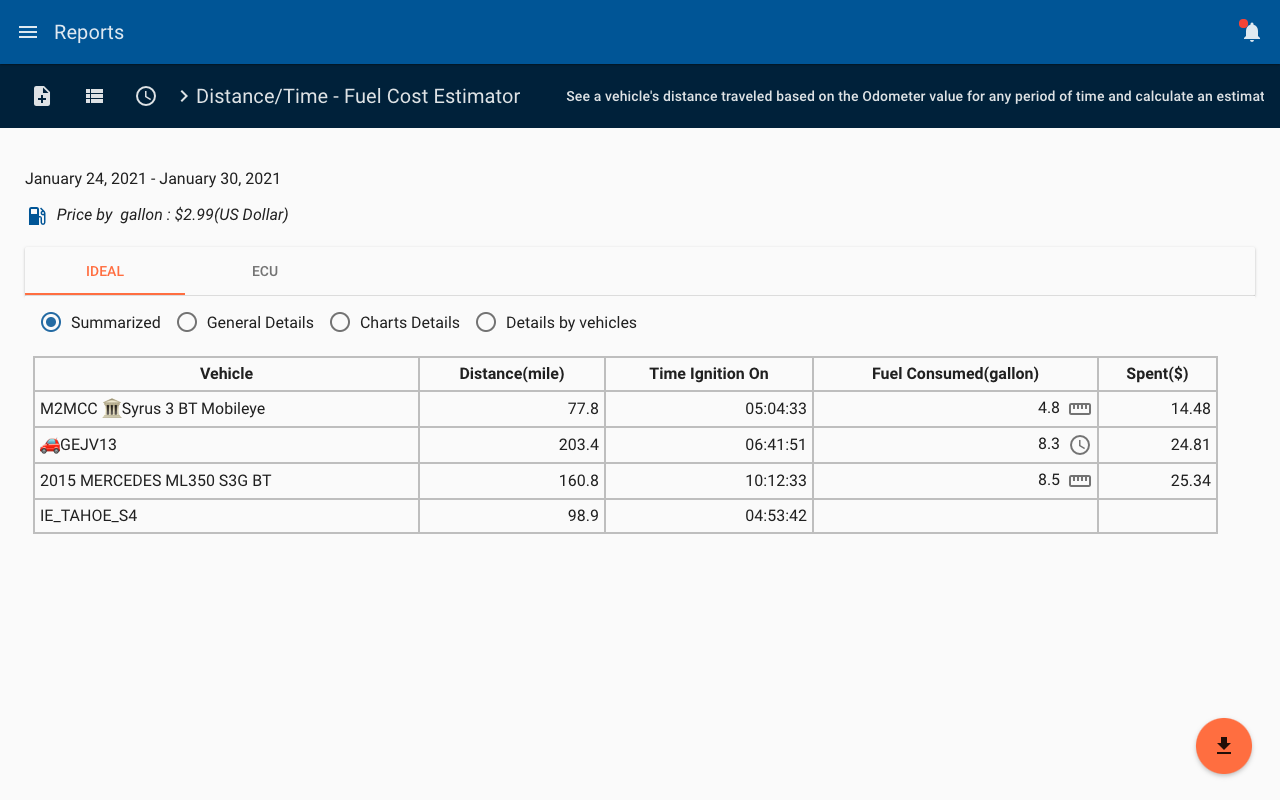
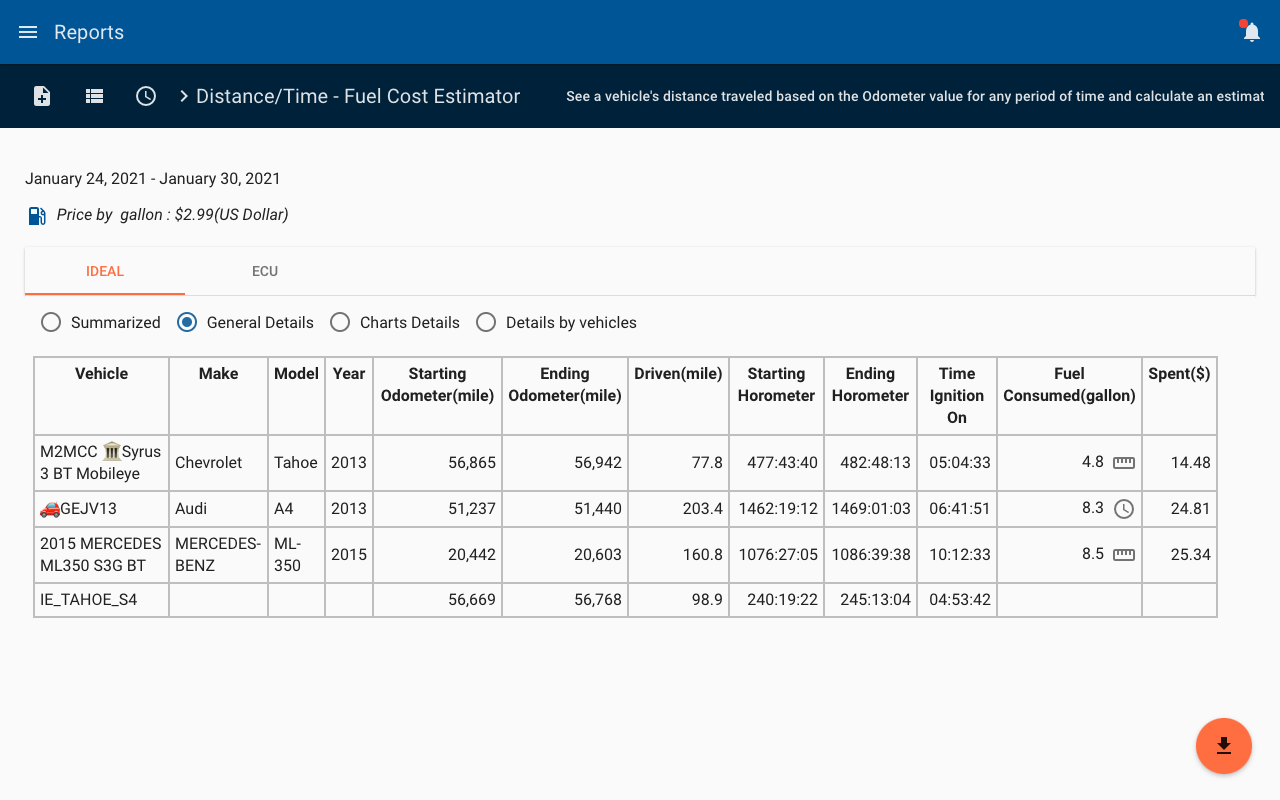
Distance/Time - Fuel Cost Estimator Report
This report gives you an estimated fuel consumption based on the distance driven or the amount of hours your engine’s running, this estimated cost is calculated from the fuel efficiency that is entered in the vehicle’s information in the Organization menu.
Contact your administrator for help with this if you’re not able to see the estimated fuel consumption.

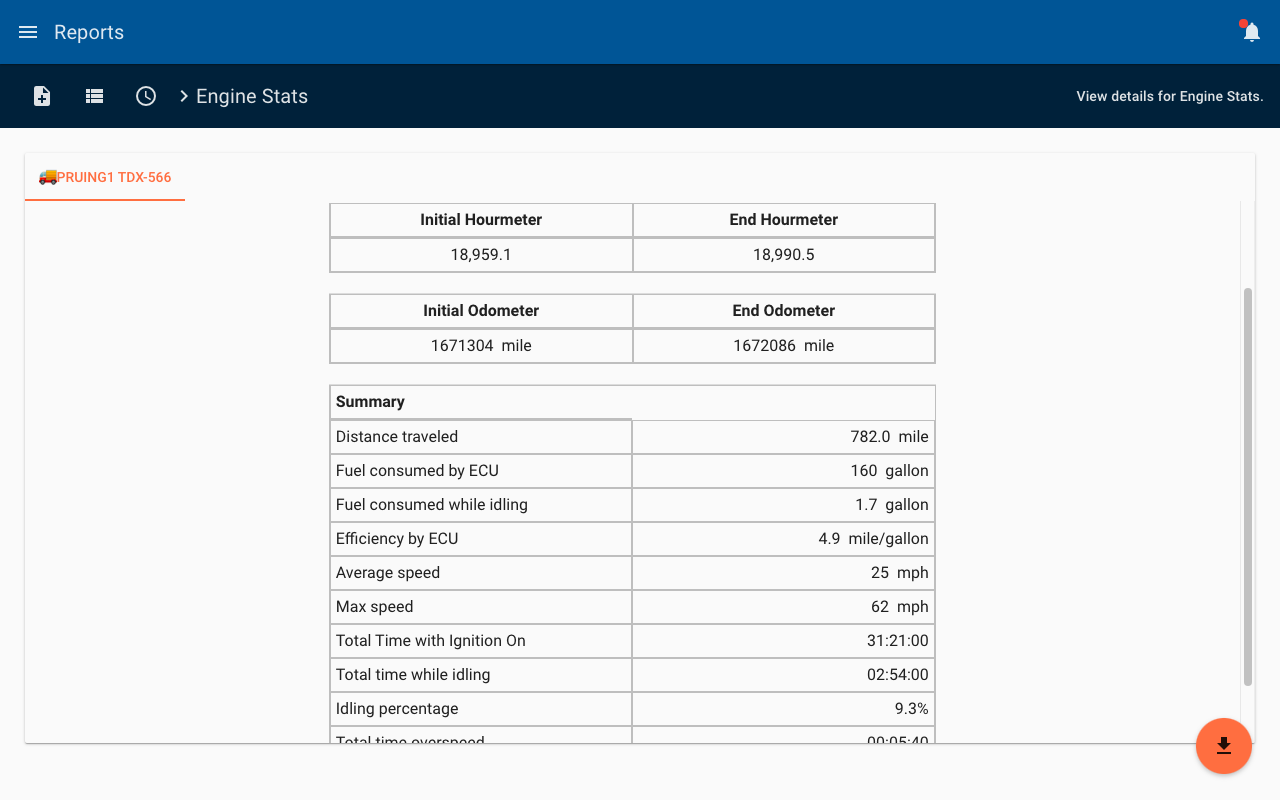
Engine Stats Report
The engine stats report takes a look at the important parameters that your truck reports, it requires an ECU accessory, but with it, you’ll be able to get information on the initial and final odometer values, as well as the total time with the ignition On and time spent idling.
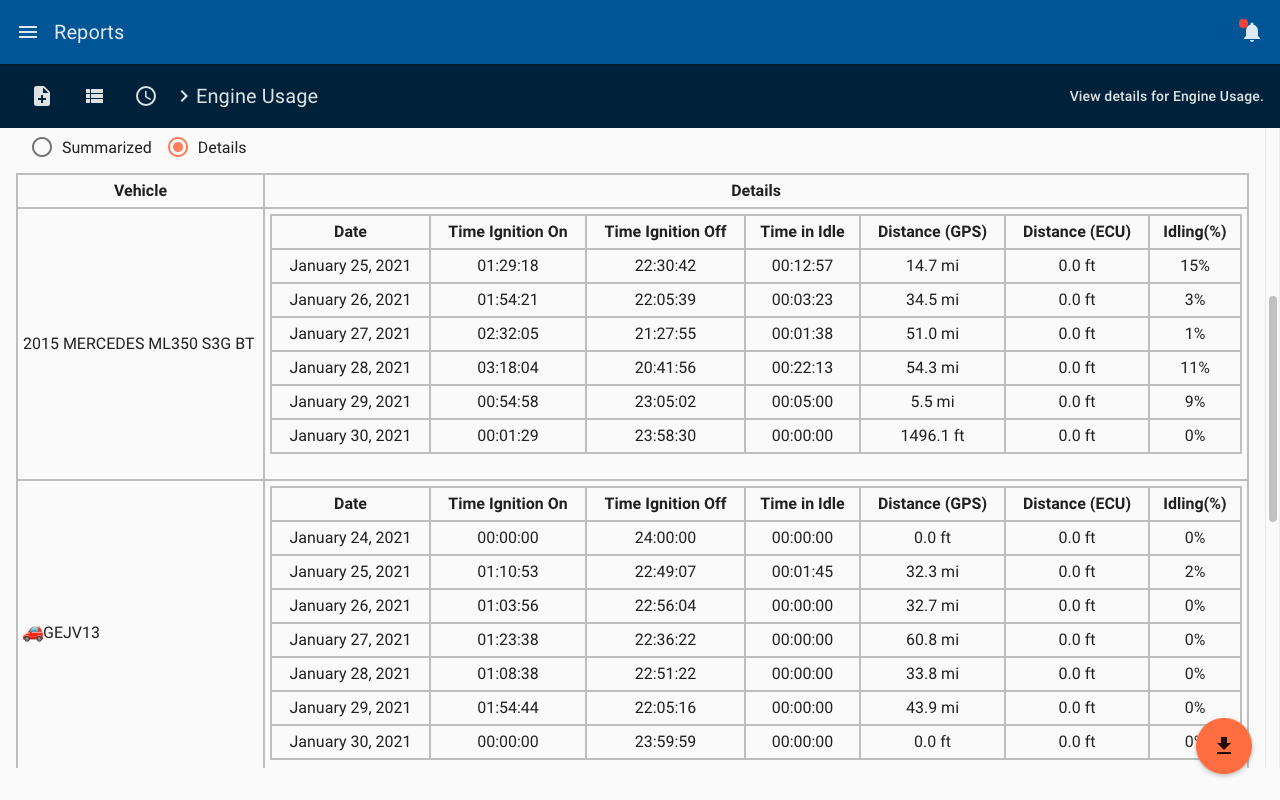
Engine Usage Report
The engine usage report gives you a quick rundown of the amount of time your fleet spent with the ignition ON and idling. Idling is calculated after 3 minutes of the ignition ON without movement.

Events Count Report
The events count report gives you the number of times an event is generated for your fleet. It can be used to find out how many times an input was activated, to know how many panic alerts were fired for a given vehicle over a week, for example.
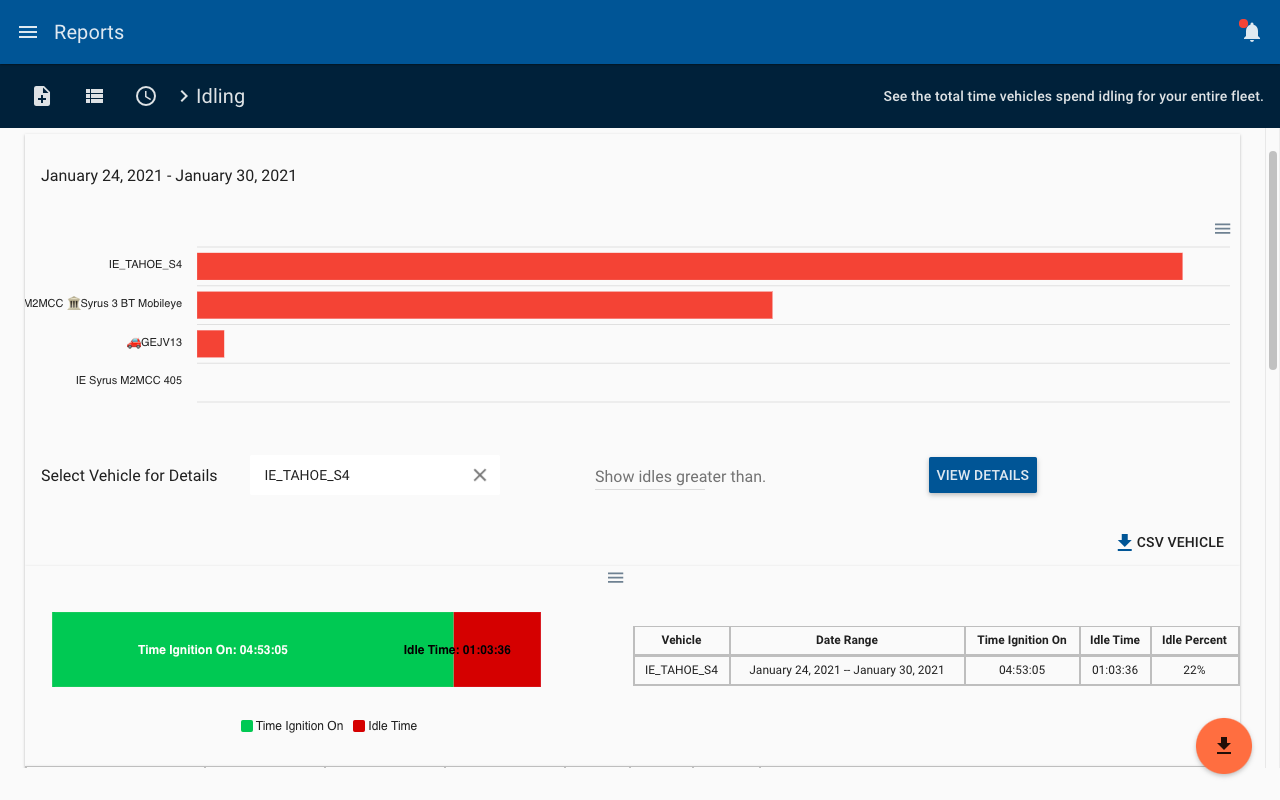
Idling Report
The idling report gives you an overview of where your vehicles spent the most time idling and for how long. It can be scheduled to be sent automatically to your email address on a weekly basis.
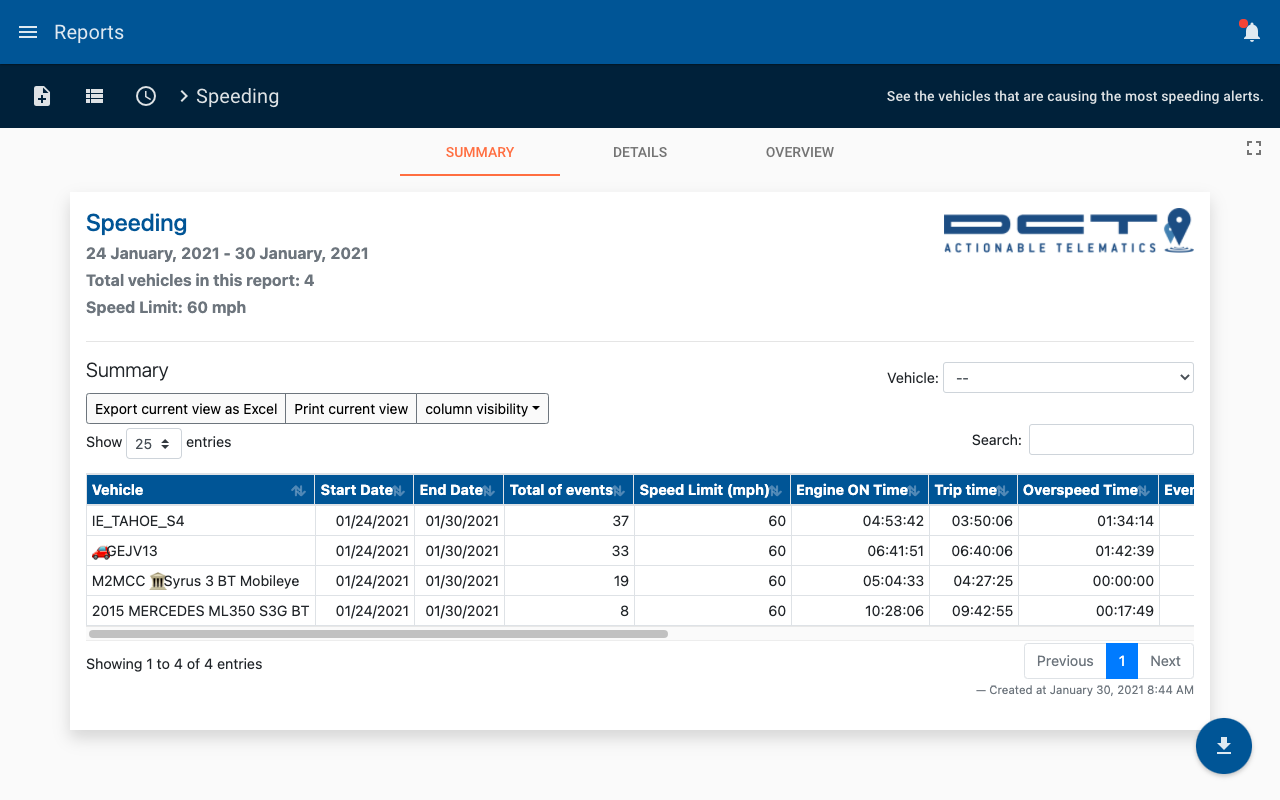
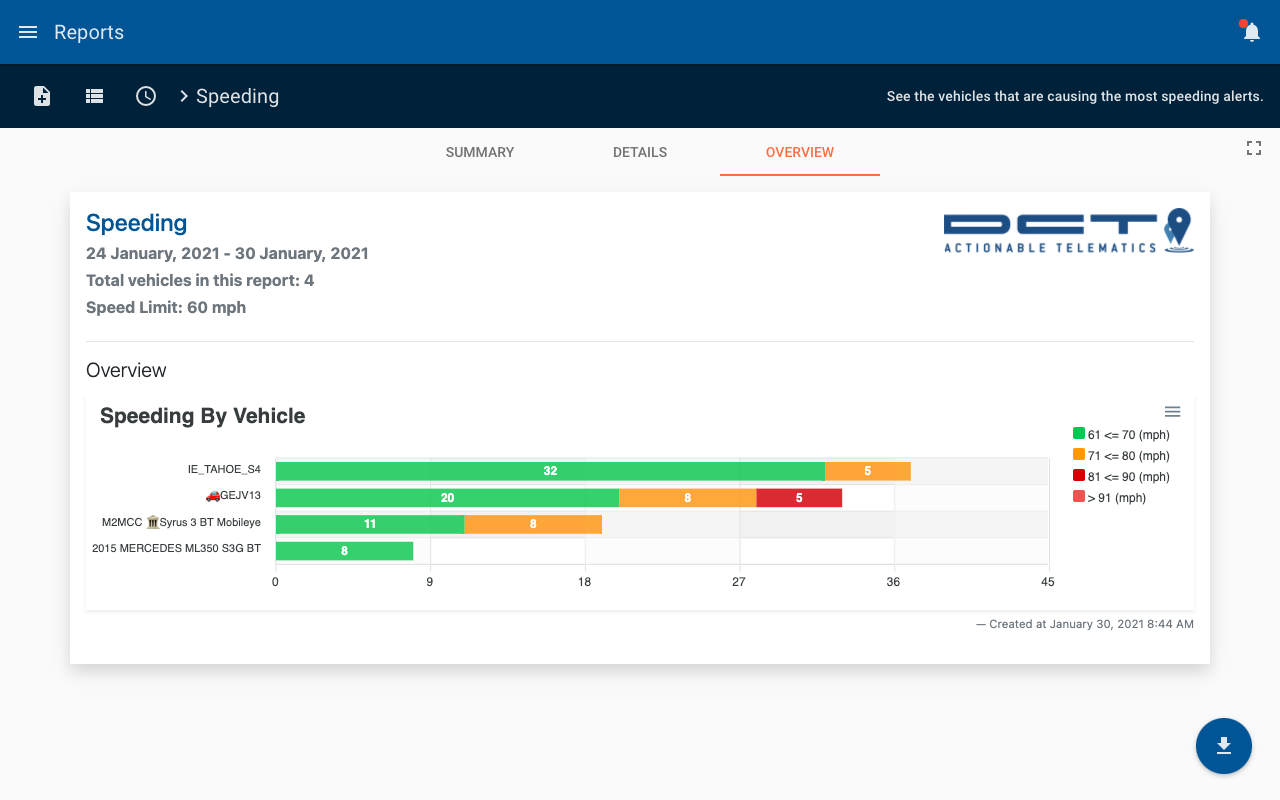
Speeding Report
The speeding report shows you all the places where vehicles went over the speed limit that you established. The report takes 4 values as input for the different speeds that you want to monitor. Start by setting a base speed as the “Set Speed Limit”, then on the other 3 inputs: green, orange, and light red, enter the increments from the Set Speed Limit.

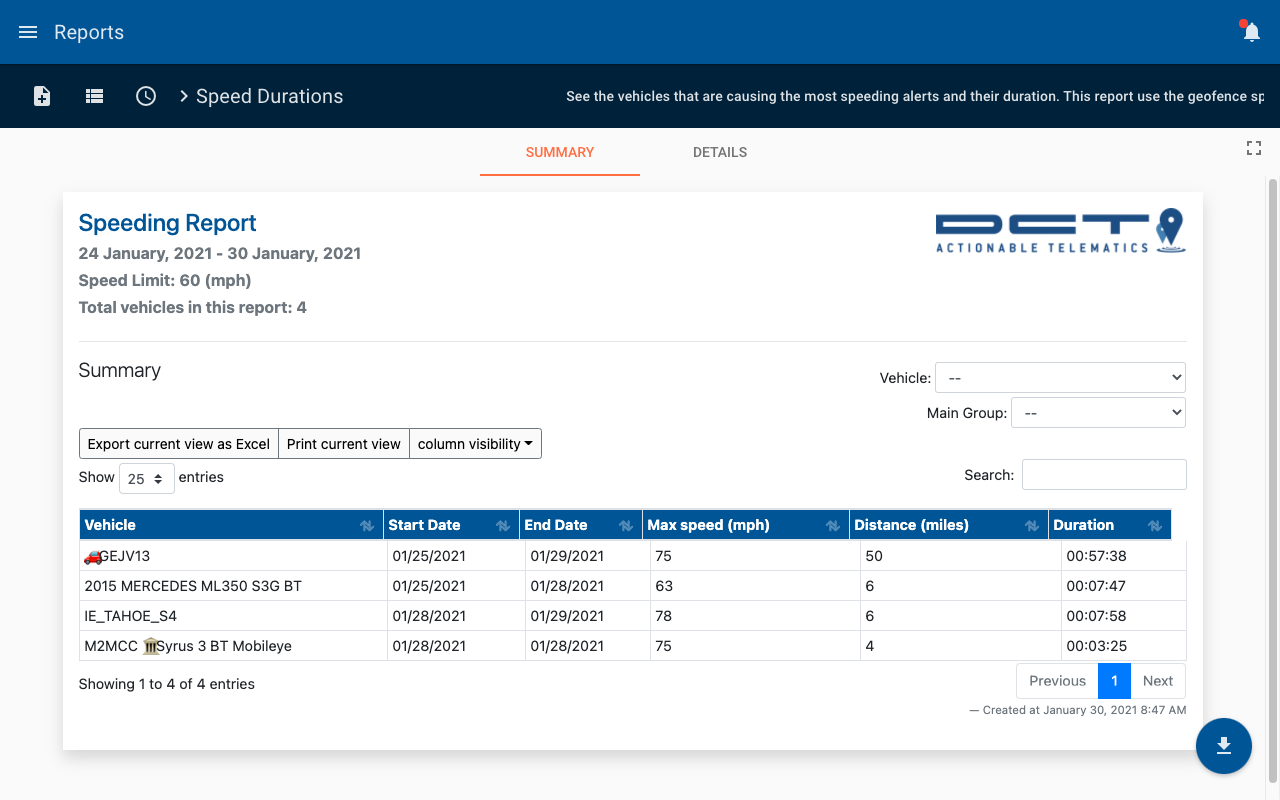
Speeding Duration Report
The speeding duration report allows you to see the total time spent speeding by any vehicle. It also works with geofences that have a speed limit property.

Metrics Summary Report
The metrics summary report shows you a summary of a particular metric that you are interested in, daily, weekly, or monthly. The possible metrics are Distance, Ignition ON time, and Idling time.

Device Behavior Reports
Offline Report
The offline report tells you which devices in your fleet are unresponsive, this report includes information such as the battery level and last phone operator the device was connected on.
Fleet Schedule Maintenance Report
The Fleet Schedule Maintenance report empowers you to establish maintenance schedules for your vehicles, specifying how frequently they should be serviced. This report is most effective when scheduled, providing you with monthly updates on the remaining mileage until the next scheduled maintenance. It's important to note that this report relies on the odometer and hour meter readings entered in the Vehicle Counters section for accurate tracking.
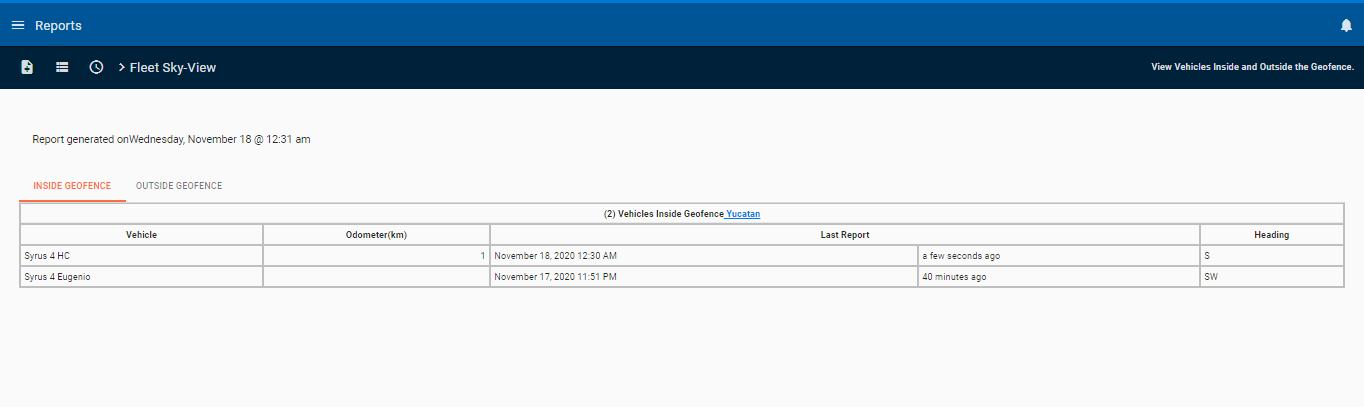
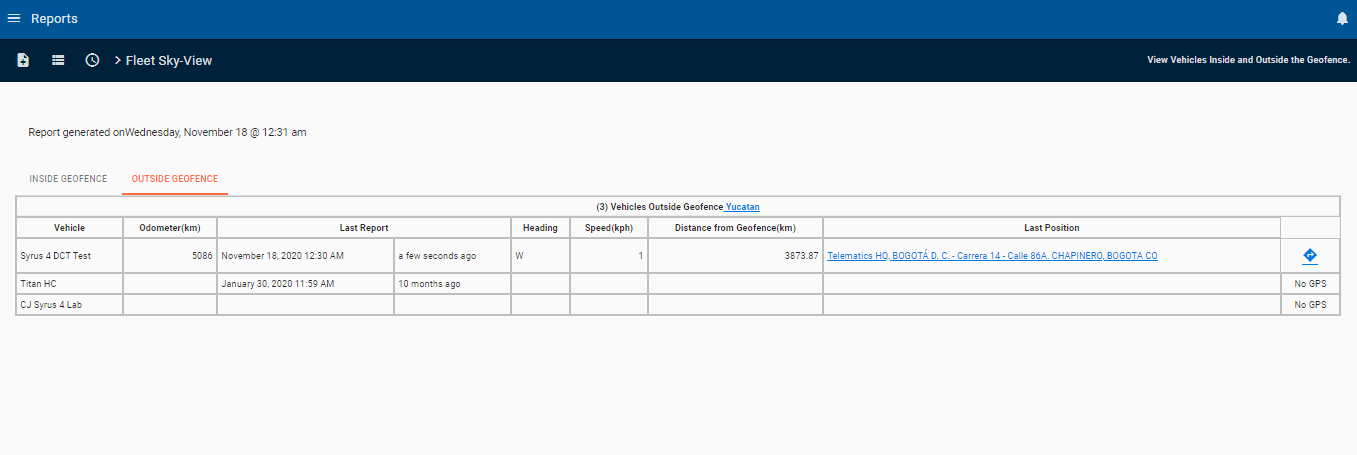
Fleet Sky-View Report
The Fleet Sky View takes any geofence you give it and tells you if vehicles are currently in or outside of it. If you schedule this report you can receive a report at 8 AM every day to know which one of your vehicles is in the geofence and which ones are not.
Report Features:
-
View Vehicles Inside or Outside a Geofence: Access real-time information about vehicles located either inside or outside a designated geofence at a specific time.
-
Scheduled Monitoring: Schedule the report to ensure vehicles arrive at designated locations punctually, aiding in efficient fleet management.
-
User-Friendly Interface: Designed for quick and easy navigation, enabling effortless access to essential information.
-
Comprehensive Data: Provides detailed insights into vehicle locations, including those positioned outside the designated geofence area, for comprehensive monitoring.
Inside:
Outside:
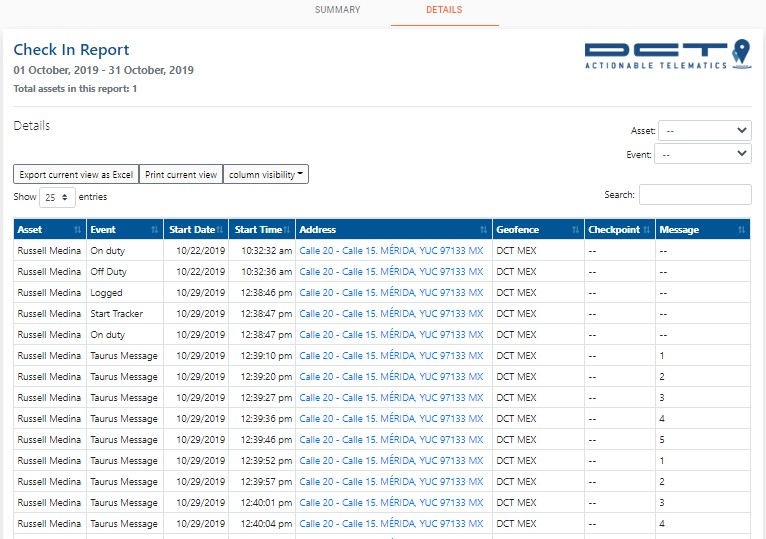
Taurus Check-In Report
The Taurus check-in report extends the functionality of the Taurus tracking app for your phone and tells you all the places that you checked into, as well as the pictures captured in these places.
Report Features:
-
Duty Time Analysis: Monitor the duration your Taurus tracker remains on duty, providing insights into operational hours.
-
Chat Log Access: View the chat log with the app operator directly within the application, facilitating communication management.
-
Photo Gallery: Access photos taken through the application for enhanced visual documentation.
-
Check-in Log: Review the log of check-ins made directly from the application, allowing for efficient tracking of activities and interactions.

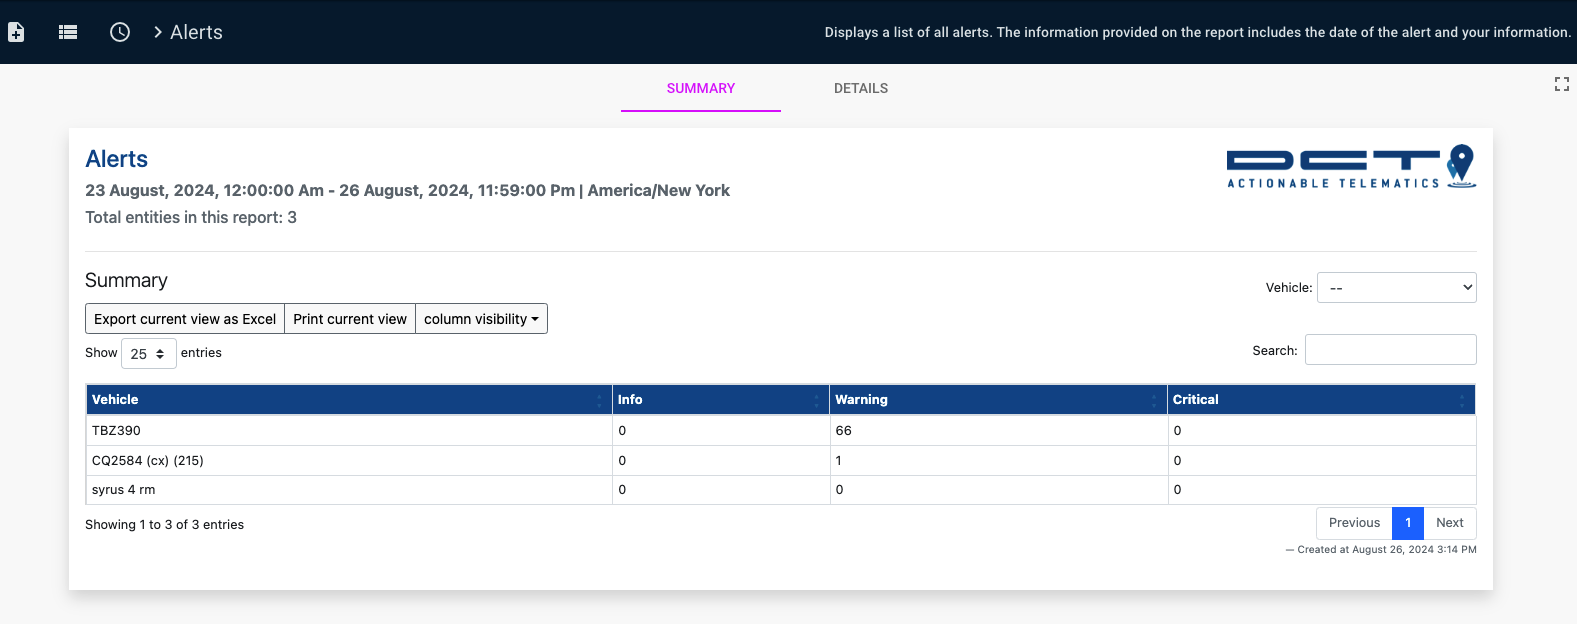
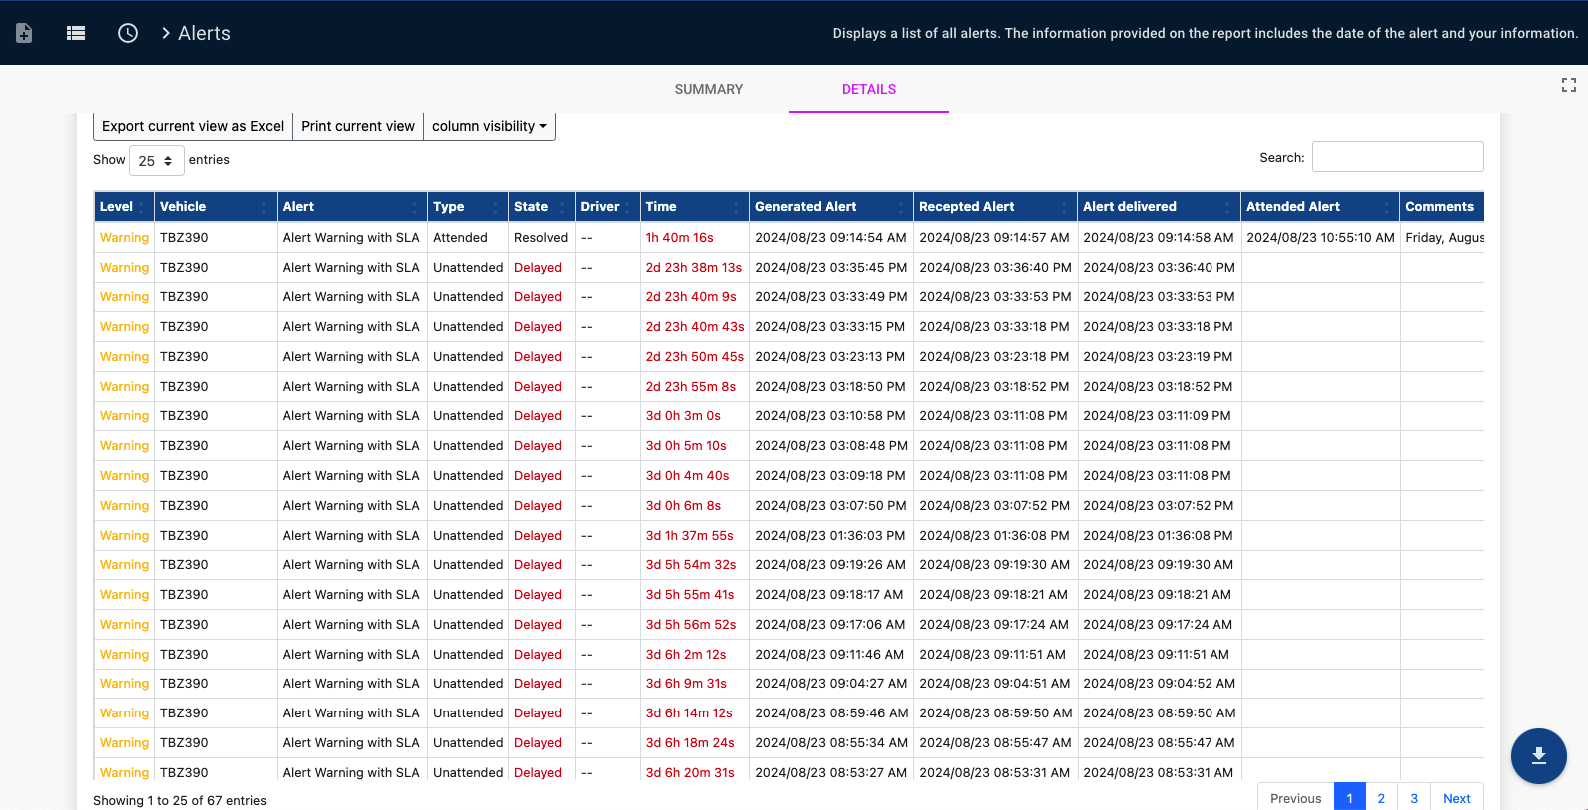
Alerts Report
The alerts report includes a list of all generated trigger alerts for an entity. It allows you to filter on one specific alert so you can focus on any one incident. The report includes alert information such as the alert type (attended/unattended), state (Resolved, Canceled, Delayed), level, the generated date, etc.
Use of Admin Mode When Generating ReportsIt is recommended to generate reports using a standard (non-admin) user account. Using an admin account—particularly when a high volume of alerts is associated with each user—is not advised, as it may impact performance or skew report accuracy
Report Features:
-
Alert Monitoring: Easily access attended and unattended alerts generated by the system for comprehensive oversight.
-
Detailed Alert Information: View specific details of each alert, including location information, providing contextual insights into the event.
Custom Options
-
Alert levels (info, warning, critical): Limits the fetched alerts to the checked levels.
-
Alert categories (multi-select): filters “details” to show only alerts whose category is in the list.
-
False positives (include / exclude / show only):
What it does:
include: shows all alerts.
exclude: removes canceled (is_voided) alerts from “details”.
show_only: keeps only the canceled ones. -
Nearby checkpoints: Adds the “nearby” column with the closest geofence/checkpoint and the distance.
-
Filter by geofence duration:
Goal: keep only alerts whose stay in a geofence exceeds the trigger’s configured cancellation time (countdown).
Example: If a trigger is configured to activate after 2 hours of vehicle presence in a geofence, it should only fire once that time threshold is exceeded. However, due to data delays or brief pass-throughs, a trigger may incorrectly activate even if the vehicle didn't stay for the full 2 hours.
These are considered false alerts, and this filter identifies and removes them from the results, ensuring only valid triggers are shown.
How it works:
Detects triggers with cancel/countdown.
Calculates “time in geofence” per alert (visits_time_geofences).
Filters “details” keeping only those that exceed that threshold(countdown).
Recalculates “summary” with the resulting per-level counts.
Useful for: discarding brief “pass-throughs” and prioritizing real stays.
Requirements: Select triggers with countdown and have an auxiliary trigger that cancels the countdown of the first trigger
https://support.digitalcomtech.com/forums/topic/use-of-the-countdown-option-in-triggers/
NoteThe report requires a trigger with the “ALERT” action selected to be created before generating.
In the case of permanence alerts, it is necessary that the trigger has a canceller, and that both the main trigger and the canceller are associated with the basic user, so that when the report is generated from the non-admin user, their alerts are correctly displayed.
Event Analysis Reports
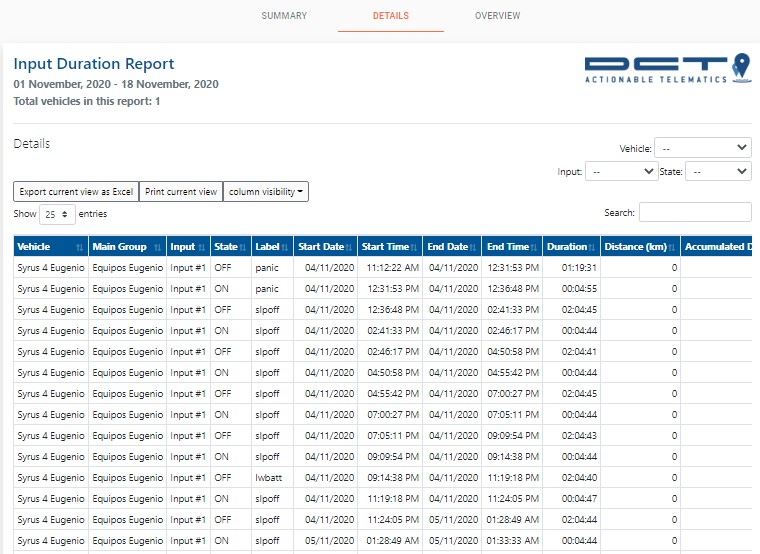
Input State Duration Report
The input state duration report shows you the total time that a sensor was in an active and an inactive state.
Use this to find out how long a door was opened or how long a switch was turned ON in your fleet.
Requirements:
- Works with standard device inputs
- IO-expander accessory (optional)

Scheduled Reports
Scheduled Report
To set up scheduled reports, navigate to the Scheduled Reports section by clicking on the clock icon located on the top left side of the page.
Here's how it works: You create a scheduled report to be delivered periodically, such as daily at a specific time, weekly on a chosen day, or monthly.
Next, specify the duration of data you want to include in the report. For instance, if you receive the report every Monday at 8 AM, determine how far back you want the data to go from that day. This parameter, referred to as "back," is filled in when creating the report.
- Create
- To create a new scheduled report you’ll need to click on the create button on the bottom right, this will open a dialog where you’ll enter information about the report you want scheduled.
Please note that depending on the report that you select you’ll have some additional fields to enter which are required. For example, the speeding report requires that you enter the speed limit, etc.
When you receive the email the name of the report will be sent in the Subject of the email.
- To create a new scheduled report you’ll need to click on the create button on the bottom right, this will open a dialog where you’ll enter information about the report you want scheduled.
- Edit
- Once the report is created you can click on the edit (pencil) icon which will bring up the dialog again, and here you can edit who will receive the report.
Updated 4 months ago